Trade Wars are just an excuse to sell — we've known for a while this moment in time would come. Libor, Libor, Libor Pants On Fire — Stocks Can't Go Up b/c soaring short term rates pic.twitter.com/2Wo4TaNvMh
— Alastair (@StockBoardAsset) April 7, 2018
$VIX holds daily 50sma. Next vol explosion next week? pic.twitter.com/rr4J0MSURh
— Alastair (@StockBoardAsset) April 7, 2018
MARKETWATCH: "The Stock Board Asset blog says investors are getting sucked into the stock market despite all the warning signs" $SPX $VIX (Oct'17) https://t.co/YtfiXQj76Q pic.twitter.com/TGbEKXRKAw
— Alastair (@StockBoardAsset) April 7, 2018
https://twitter.com/dont_lose_money/status/982792341789597697
If nobody is raising wages that means that the great worker shortage is one giant lie https://t.co/aCnJA7gFGB
— zerohedge (@zerohedge) April 8, 2018
Baltic Dry Index versus $SPX pic.twitter.com/yoXX5gkOTX
— Alastair (@StockBoardAsset) April 7, 2018
https://twitter.com/OccupyWisdom/status/982818315440656384
https://twitter.com/economisms/status/982811529891299333
https://twitter.com/OccupyWisdom/status/982808583652900864
The Current Stock Market Is a Mirror Image of Pre-Crash 1929
Only this time, P/Es are higher and there’s no booming postwar economy to fall back on.
The 1929 crash happened while the US economy was truly, robustly strong. Still, overleveraged investors and corporations took it down.
Today? We have an artificially inflated market overlaying a weak economy and overleveraged investors and corporations. Change the year ‘1929’ in the text below to ‘2018’, factor out 1929’s strong economy and replace it with weak one paired with a trade war, and you’ve got an accurate portrait of the present day market primed for a fall.
On October 16, 1929, Yale economist Irving Fisher wrote in the New York Times that “Stock prices have reached what looks like a permanently high plateau.” Eight days later, on October 24, 1929, the stock market began a four-day crash on what became known as Black Thursday.
In the Roaring Twenties, optimism and affluence had risen like never before. The economy grew by 42% (real GDP went from $688 billion in 1920 to $977 billion in 1929), average income rose by about $1,500 and unemployment stayed below 4%.
In the wake of World War I, the U.S. was producing nearly half of global output and mass production made consumer goods like refrigerators, washing machines, radios and vacuums accessible to the average household. Investing in stocks became like baseball – a national pastime. As newspaper headlines trumpeted stories about teachers, chauffeurs and maids making millions in the stock market, concerns about risk evaporated.
Everyone wanted to get in on the action and credit was readily available. In particular, businesses and individuals borrowed money to buy stocks “on margin.” Buying on margin meant that an investor could put down 10-20% of their own money and borrow the rest from their stock broker. Even banks were buying stocks on margin, and, since no law prevented it, some used their customers’ deposits to do so.
The chart below shows the Dow Jones Industrial Average (a measure of stock market performance) from 1920 to September 1929 and how, for close to a decade, the stock market had consistently gone up.
On March 25, 1929, the stock market corrected, falling 10% from its 52-week high. Margin calls were made and investors panicked initially but reassurance from a group of bankers that their banks would continue to lend assuaged concerns and the market recovered.
The market would go on to fall 30% in 5 days.

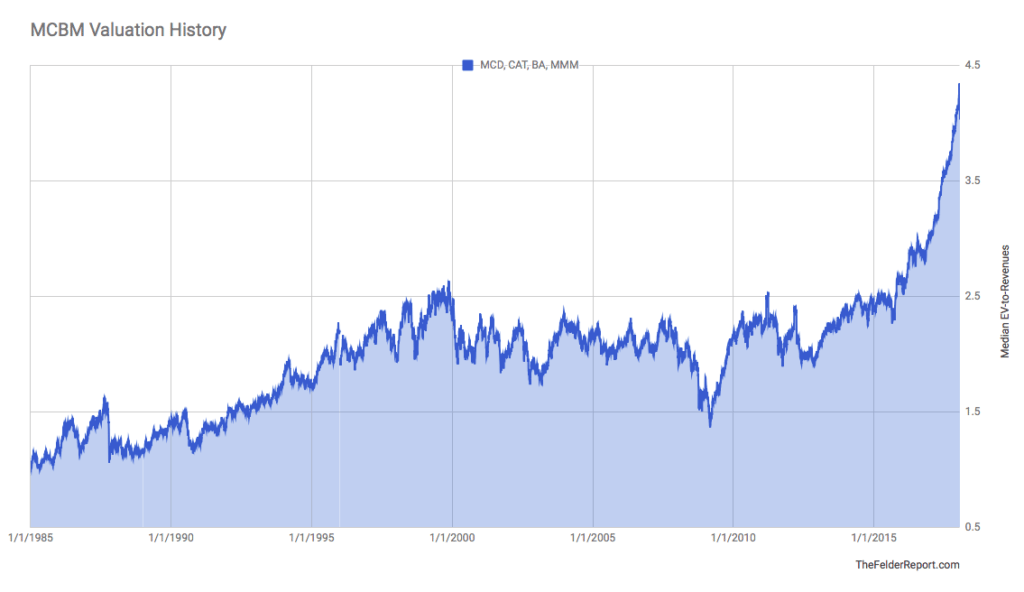
Chart of the Day: The Chart That’s Off The Charts