The stock market is finally waking up to fact that a recession is already here.
The first sign was copper.
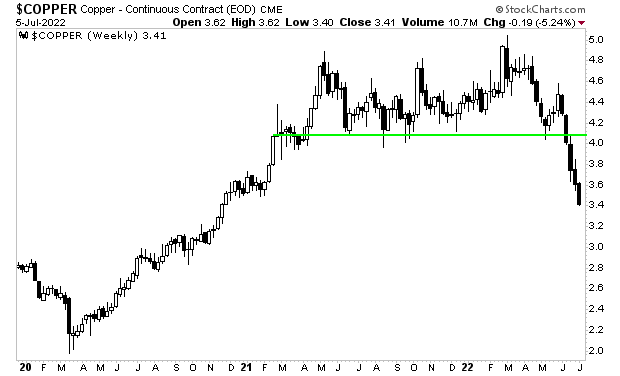
Copper is commonly referred to as “Dr. Copper, the commodity with a PhD in economics.” The reason for this silly name is that the commodity is extremely economically sensitive due to it having so many industrial uses. When the economy is booming copper rallies and when the economy contracts, copper falls.
Copper has collapsed, wiping out half of its pandemic gains. That is correct, copper erased HALF of the entire move from the 2020 lows… a move that was fueled by over $15 trillion in global stimulus. And it did it in the span of two months.
Now it’s oil’s turn.
Oil is used in practically everything you wear, eat, touch, or drive.
Oil or oil derivatives are present in lipstick, Vaseline, solar panels, polyester (stain resistant clothes), chewing gum, crayons, Aspirin, pantyhose, sneakers, detergent, CDs, concrete/cement, plastics of any kind, food additives, fertilizers, pesticides, candles, milk cartons, pen ink, and more.
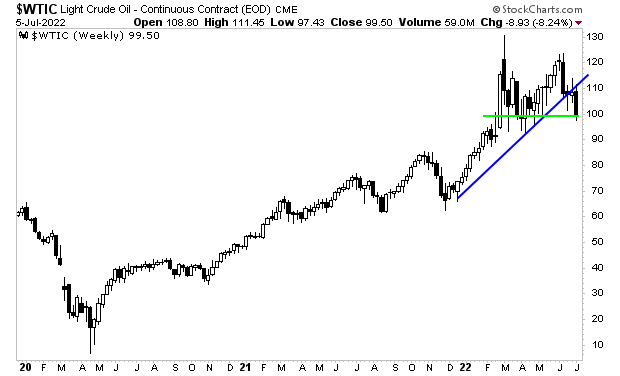
Put simply, oil is extremely economically sensitive. And yesterday it was annihilated,
dropping over 9% in a single day to below $100 per barrel. The uptrend is broken here and the commodity is barely clinging to support.
Both of these commodities… which are HIGHLY associated with economic growth, are collapsing. What does this tell you about the true state of the economy today?
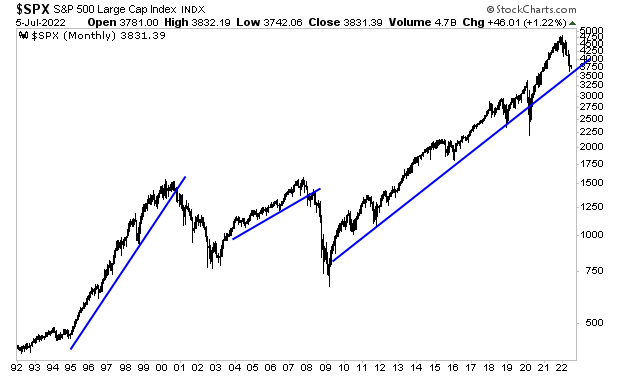
Worst of all, this spells BIG TROUBLE for the stock market. The last three recessions involved stock market crashes… will this one be any different?
Take a look at the following chart and tell me what you think…