via hedgopia
Debt addiction is pervasive among consumers, corporations as well as the federal government. Several debt-related metrics are in uncharted territories. The craving is built into the system and can continue until markets rebel.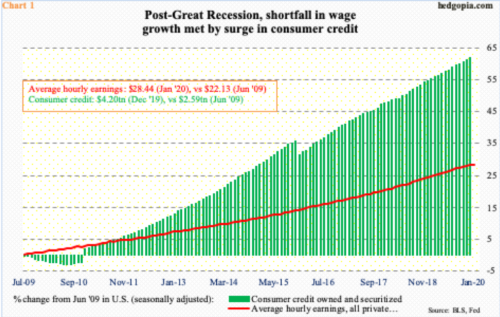
In December, U.S. consumer credit grew 4.7 percent year-over-year to a new high of $4.2 trillion. Last year alone, consumers added $187.4 billion to their debt load. (Consumer credit primarily consists of credit card, auto and student loans, and does not include $10.5 trillion in home mortgage.) The growth in consumer credit eclipses growth in hourly earnings. In the 12 months to January, private-sector average hourly earnings increased 3.1 percent to $28.44.
Post-Great Recession, wage growth consistently averaged in the two to three percent range, while consumer credit grew much faster (Chart 1). From June 2009, consumer credit cumulatively grew 62 percent, while hourly wages only rose 28.5 percent. It was as if consumers are taking on debt to offset the shortfall in wage growth.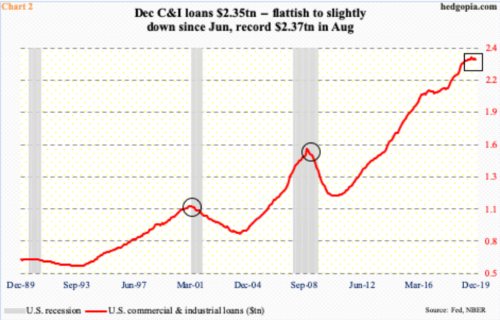
But the debt culture is not just a recent phenomenon. It began rising particularly in the 1980s. Take commercial & industrial (C&I) loans.
In December, C&I loans dropped $9.3 billion month-over-month to $2.35 trillion, not that far away from last August’s record $2.37 trillion. In fact, they have essentially gone sideways since June.
That said, the buildup this cycle is eye-catching (Chart 2). In October 2010, these loans only stood at $1.18 trillion. Go back further – into the ‘90s and ‘80s – they were much, much smaller.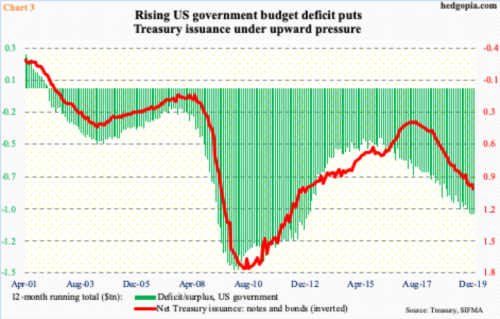
It is not just consumers and business. Government is not immune from this either.
In the 12 months to December, U.S. budget deficit exceeded $1 trillion. As a matter of fact, this was the third month in a row of $1tn-plus of red ink. In the current cycle, the federal deficit bottomed at $403.6 billion in January 2016, before persistently rising (Chart 3). This is taking place at a time of economic expansion, not contraction.
Accordingly, the Treasury is actively issuing new debt. In the 12 months to December, issuance of Treasury notes and bonds totaled $963 billion – a seven-year high.
Speaking of issuance, U.S. corporations opened 2020 with a bang. In the first month of the year, corporate bond issuance came in at $170.3 billion, up 33.7 percent from the corresponding month of last year. Of this, investment-grade was $132.8 billion, versus $107 billion last year, and high-yield $37.5 billion, versus $20.4 billion last year.
Chart 4 annualizes 2020 using January’s data, so it cannot be taken at face value. The year has just begun; anything could happen in the remaining 11 months. But the fact remains that issuance this cycle has been massive – $14.6 trillion between 2009 and 2019.
Not surprisingly, non-financial corporate debt outstanding stood at $10.1 trillion as of 3Q19 – a new high. This is up $3.7 trillion just this cycle – that is from the time Great Recession ended in 2Q09.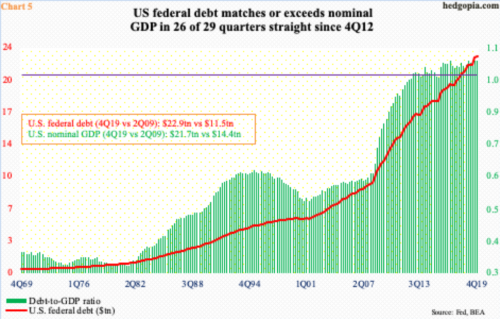
The four charts above highlight the increasing reliance on debt. Chart 5 looks at the same thing from another angle. Between 2Q09 and 4Q19, nominal GDP went from $14.4 trillion to $21.7 trillion, for a 51.4 percent increase. Federal debt over the same time period went from $11.5 trillion to $22.9 trillion, for a 98.3 percent surge. In other words, it is increasingly taking more and more debt to produce the same output. The debt-to-GDP ratio has maintained at one or higher in 26 of the last 29 quarters. These are uncharted territories, hence difficult to say when unwinding will begin in earnest. The addiction is so pervasive it is difficult to break the habit unless forced by markets, which, if past is prelude, is a matter of when not if.