Wolf Richter wolfstreet.com, http://www.amazon.com/author/wolfrichter
House prices set post-collapse record in Miami, flatten out in Las Vegas, Phoenix & once red-hot Charlotte, linger below Oct 2018 levels in Washington, DC & Chicago. Cincinnati & Detroit in a show of their own.
On one side, there are “The Most Splendid Housing Bubbles in America” – the San Francisco Bay Area, the metros of Los Angeles, San Diego, Seattle, Portland, Boston, New York, and others – where home prices have blown past the crazy highs during Housing Bubble 1, which imploded so spectacularly. On the other side are markets where home prices have not yet reached their splendid levels of Housing Bubble 1, or never experienced Housing Bubble 1 to begin with. And this is the other side:
Miami
In the Miami metro, poster child of Housing Bubble 1 and Housing Bust 1, single-family house prices rose 0.9% in February from January, to a Housing-Bubble-2 record, according to the CoreLogic Case-Shiller Home Price Index. They’re up 4.7% from February last year and have risen within just 12.6% of the crazy peak of Housing Bubble 1.
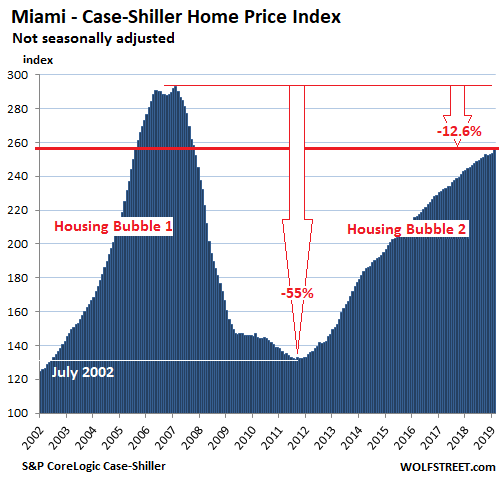
The Core-Logic Case-Shiller Home Price Index was set at 100 for January 2000; an index value of 200 means single-family house prices have doubled since January 2000. In Miami’s chart, the Case-Shiller Index peaked at 293 in February 2007, indicating that prices nearly tripled in seven years. Then prices collapsed, giving up most of those gains over the following years. By August 2011, prices were back where they’d been in July 2002.
Since then, prices have been clambering back up, trying to regain those crazy highs of Housing Bubble 1. The February index level of 256 indicates that house prices are up 156% from January 2000.
Phoenix:
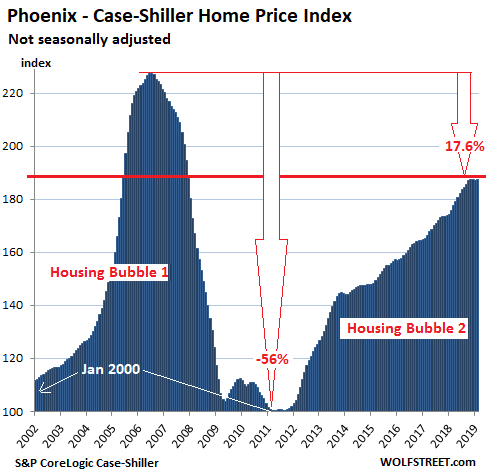
The Phoenix metro, in terms of steepness, was an unparalleled mind-bender of Housing Bubble 1 where the Case-Shiller index exploded by 80% in two-and-a-half years through July 2006 before collapsing back to 2000-levels by 2011. But it has not given up its spirit. Single-family house prices in February were flat compared to the prior three months, but are up 6.7% from February last year and now within just 17.6% of their crazy peak in Housing Bubble 1:
The Core-Logic Case-Shiller Home Price Index is a rolling three-month average; this release tracks closings that were entered into public records in November, December, and January.
It’s based on “sales pairs,” comparing the sales price of a house in the current month to the last transaction of the same house years earlier (methodology). This eliminates the problems of median price indices (changes in mix) and average price indices (a few big outliers). The index tracks how much many more dollars it takes to buy the same house. In other words, it tracks how fast the dollar is losing or gaining purchasing power with regards to same house over time. This makes the index a measure of house-price inflation.
Las Vegas:
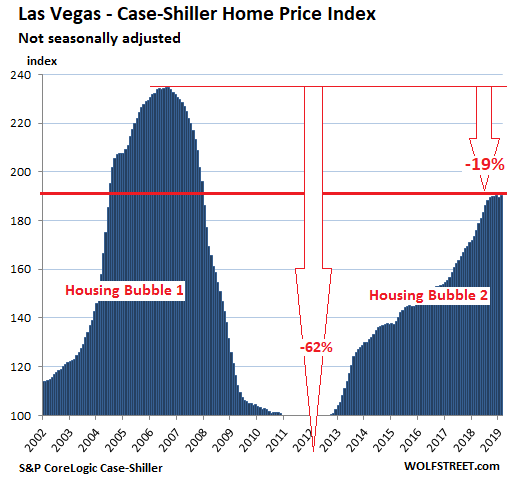
The Case-Shiller index for the Las Vegas metro in February ticked up a tiny bit back to levels where it had been in October, thus expanding its flat spot to five months. However, after sharp price gains mid-2018, the index is still up 9.7% from February last year. During Housing Bust 1, Las Vegas may have set a record for the speed collapse. From peak to trough, the index collapsed 62% to levels last seen in the 1990s. But over the fist three years of the five-and-a-half-year down cycle, they plunged 56%. Now house prices are clawing their way back up toward those crazy highs and are within 19%:
Chicago:
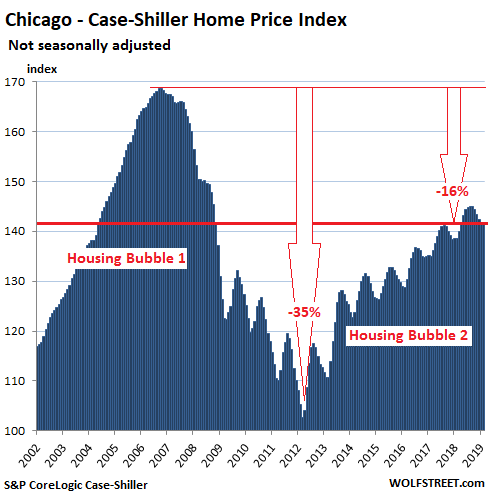
In the large and diverse Chicago metro, house prices were unchanged in February compared to January and remained 2.3% below the post-collapse peak of August last year. This decline is about in line with prior seasonal declines. Year-over-year, the index is up 2.2% but remains 15.9% below its Housing Bubble 1 peak:
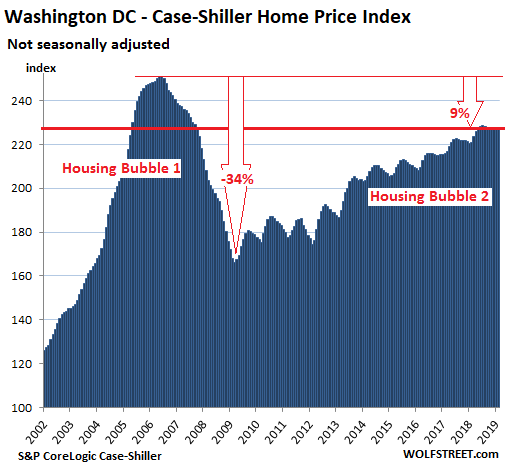
Washington DC:
House price in the Washington D.C. metro ticked up in February from January, which had been the lowest point since May 2018. Due to the price surge in early in 2018, however, the index is still up 3.0% year-over-year. The index has now moved within 9.3% of its ludicrous levels at the peak of Housing Bubble 1:
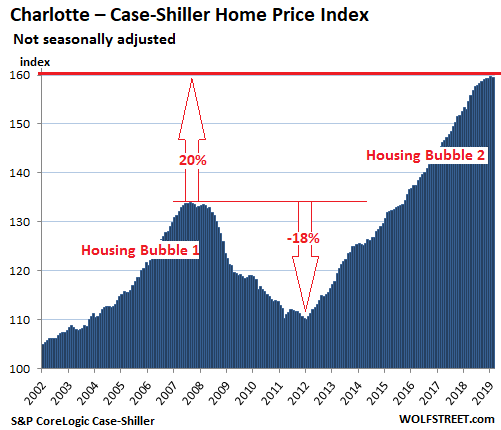
Charlotte:
The Case-Shiller index for the Charlotte metro ticked down a tiny bit in February compared to January, and has now been essentially flat for five months. But until October last year, prices had been on a relentless surge. The index is up 4.2% year-over-year and has risen 19.1% beyond its peak of Housing Bubble 1:
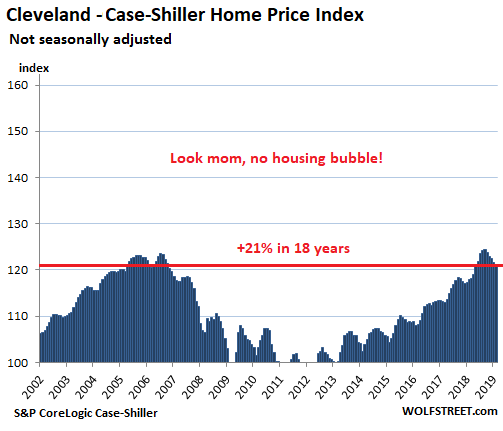
Cleveland:
In the Cleveland metro, house prices inched down again in February from January and are now below where they’d been in June 2018. With an index value of 121.2, the Case-Shiller Home Price Index indicates that home prices have risen just 21.2% since January 2000. Housing Bubbles 1 and 2 have bypassed Cleveland, but not Housing Bust 1. The left scale IS at the minimum range in this series, going from 100 to 160, same as Chicago, while Miami’s scale extends to 300:
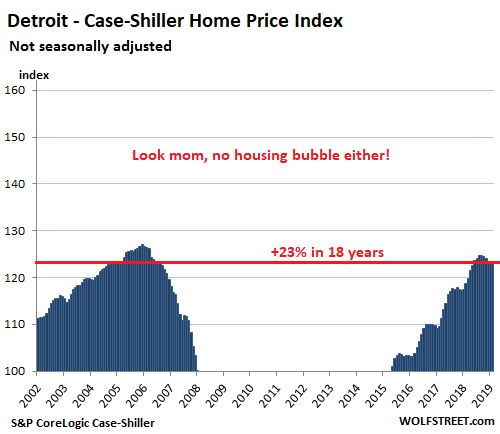
Detroit:
The index for the Detroit metro ticked up again in February from January but remains down a smidgen from the peak in July 2018. Since 2013, prices have risen 47%. But since January 2000, prices are up only 23.4%, and thus Detroit is not the weakest housing market in the Case-Shiller list of 20 cities – that honor belongs to Cleveland (+21.2%):
Condo prices fell year-over-year in New York. In San Francisco, SoCal, and Seattle, year-over-year price gains shrank to nearly nothing. Despite the hype, Boston prices continued to decline. Denver, Dallas and Atlanta eked out records. Read… The Most Splendid Housing Bubbles in America, April Update