Wolf Richter wolfstreet.com, http://www.amazon.com/author/wolfrichter
A story of spikes and new flat spots.
Home prices on a nationwide basis rose 6.3% from a year earlier (not seasonally-adjusted), according to the S&P CoreLogic Case-Shiller National Home Price Index for December, released this morning. The index has now surpassed by 6.3% the crazy peak of Housing Bubble 1 in July 2006, at which point it began to implode in spectacular fashion. Thanks to the radical and experimental monetary policies, prices were reflated by 46% since the bottom of Housing Bust 1:
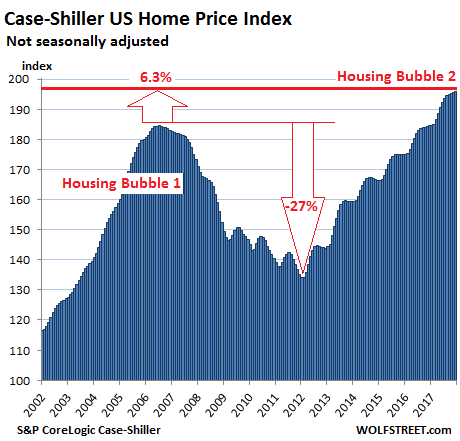
Local real estate prices, in addition to being impacted by national and global factors — such as monetary policies and offshore investors looking at US homes as an asset class — are impacted by local factors, which cause local housing bubbles, operating on their own schedules. When enough of them coincide, they form a national housing bubble. See chart above.
The Case-Shiller Index is based on a rolling three-month average; today’s release was for October, November, and December data. The index uses “home price sales pairs,” for instance, for a house that sold in 2008 and then again in December 2017. Other factors and algorithms are used to obtain a price movement. The index was set at 100 for January 2000. An index value of 200 means prices as figured by the index have doubled since then.
Here are the most splendid among the housing bubbles in major metro areas:
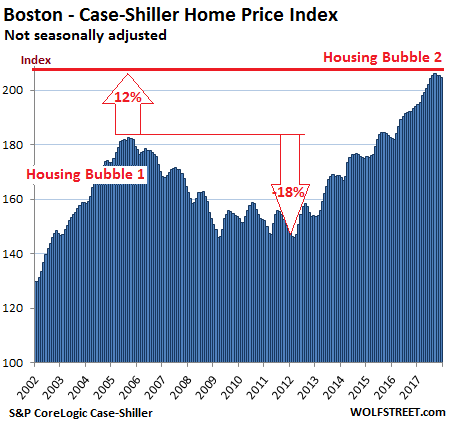
Boston:
The Case-Shiller home price index for the Boston metro edged down again on a monthly basis, the third decline in a row after 22 months of increases. It is now from six months ago, but due to the surge earlier in the year is still up 5.5% year-over-year. The monthly declines could still be within the typical seasonal variations. However, there were no seasonal variations during the relentless ascend in 2015 and 2016. During Housing Bubble 1, from January 2000 to October 2005, the index soared 82% before dropping. It now exceeds the peak of Housing Bubble 1 by 12.2%:
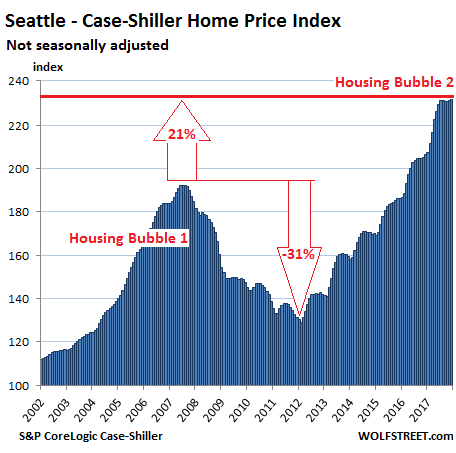
Seattle:
The Seattle metro index rose by 0.6% on a month-to-month basis to a new record, after the first two back-to-back declines in the fall since the end of 2014! The December rise tentatively ended the flat or down-trend that had started to develop. The index is up 12.7% year-over-year, 21% from the peak of Housing Bubble 1 (July 2007), and 80% from the bottom of Housing Bust 1 in February 2011:
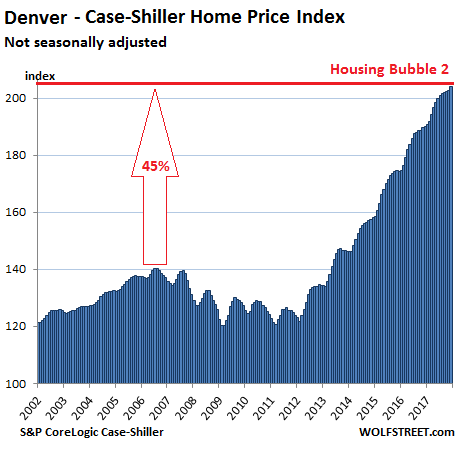
Denver:
The Case-Shiller home price index for the Denver metro rose 0.5% on a monthly basis, the 26th increase in a row. The index is up 7.4% year-over-year and 45% from the peak in July 2006. Denver’s Housing Bubble 2 is a sight to behold:
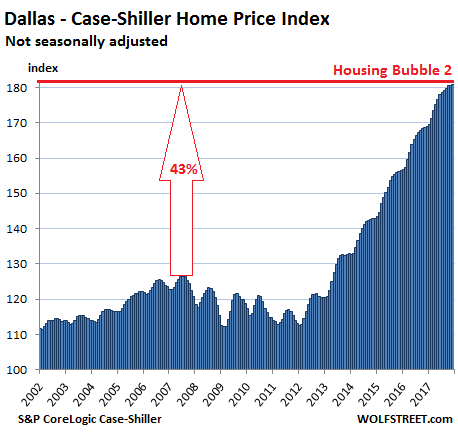
Dallas-Fort Worth:
The Dallas-Fort Worth metro index edged up on a monthly basis for the 47th month in a row. It is up 6.9% year-over-year and has skyrocketed 43% from the prior peak in June 2007. The metro’s price surge since 2012 has been stunning and relentless:
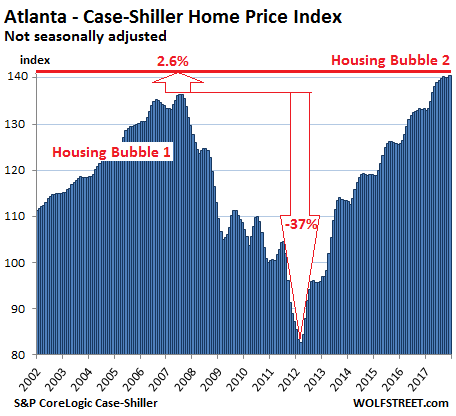
Atlanta:
The December index for the Atlanta metro has been about flat for four months in a row, in line with prior seasonal patterns, but is still up 5.4% from a year ago and is now 3% above the peak of Housing Bubble 1 in July 2007. Note that the index surged 70% since February 2012:
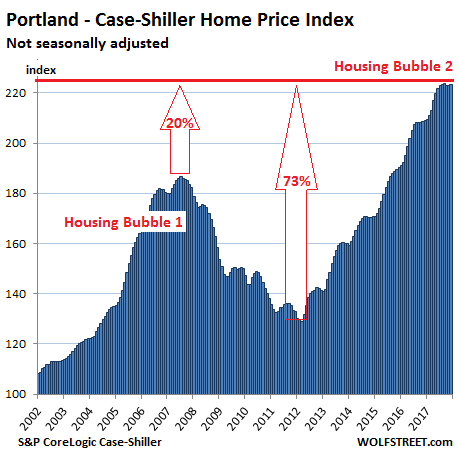
Portland:
Portland’s home price index has now remained essentially flat for five months. This is still within range of normal seasonal flat spots at this time of the year – during times when there were any flat spots at all. The index is up 6.8% year-over-year, has skyrocketed 73% since 2012, and is 20% above the peak of Housing Bubble 1. The index has ballooned 123% since 2000:
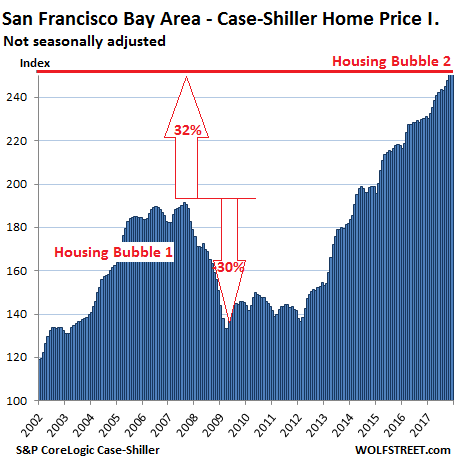
San Francisco Bay Area:
The Case-Shiller home price index for “San Francisco” — actually for the counties of San Francisco, Alameda, Contra Costa, Marin, and San Mateo, which forms the northern part of Silicon Valley — rose 0.5% in December, after jumping 1.4% in November, and 1.2% in October. It’s up 9.2% year-over-year, up 32% from the insane peak of Housing Bubble 1, and up 86% from the end of Housing Bust 1. The index has surged 153% since 2000:
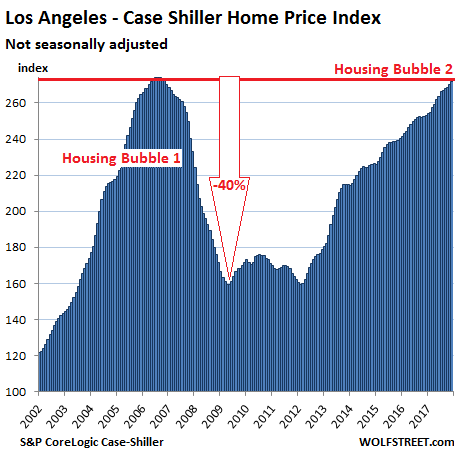
Los Angeles:
The Los Angeles metro index rose again for the month and 7.5% year-over-year. Housing Bubble 1 in Los Angeles was in a special category in terms of its height (up 174% from January 2000 to July 2006) and its steepness on both sides. The index is now less than 1% from where it had been during the peak of the housing insanity in 2006:
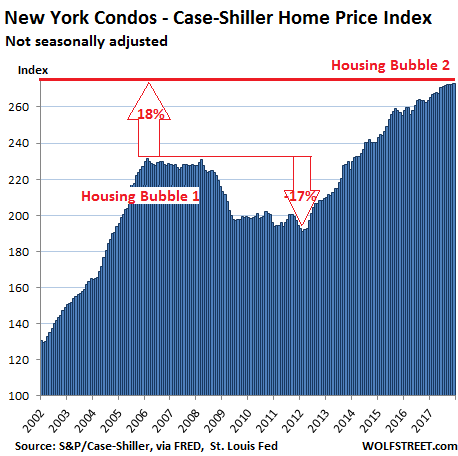
New York City Condos:
Because the New York City condo market is so large, Case-Shiller has a special index just for condos. It inched up in December and is up 3.6% year-over-year. During Housing Bubble 1, from 2000 to February 2006, the index skyrocketed 131%. The onset of QE unleashed money for Wall Street and global investors, and this kept the condo market from plunging. The index is now 17.5% above the prior peak, having surged 173% in 17 years:
This is the handiwork of asset-price inflation — when the dollar loses its purchasing power with regards to assets, such as homes. It was a specific goal the Fed has set out to accomplish in 2008 and onward, and it has succeeded splendidly. Since there has been little wage inflation over the same period, labor has been devalued with regards to assets. Many people who rely on their income from work to fund their housing needs are having to grapple with what is now called the “affordability crisis” or “housing crisis” in those cities, when it’s really just a result of the Fed’s asset price inflation and devaluation of labor with regards to assets.
Surging home prices have primed the housing market for this. Read… What will Spiking Mortgage Rates, High Home Prices, & the New Tax Law Do to the Housing Market?