Wolf Richter wolfstreet.com, http://www.amazon.com/author/wolfrichter
But wait — these are the Boom Times!
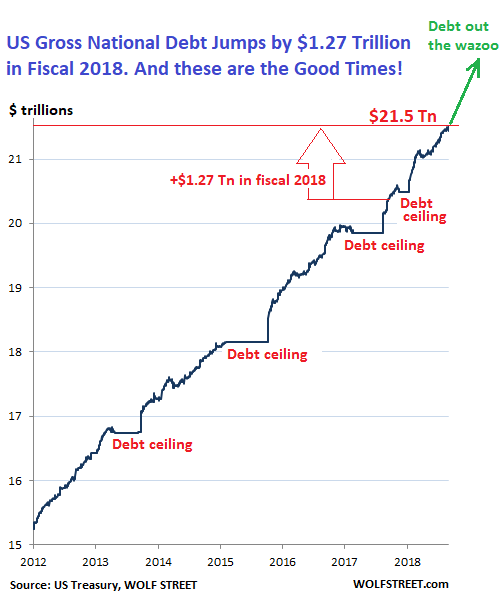
The US gross national debt jumped by $84 billion on September 28, the last business day of fiscal year 2018, the Treasury Department reported Monday afternoon. During the entire fiscal year 2018, the gross national debt ballooned by $1.271 trillion to a breath-taking height of $21.52 trillion.
Just six months ago, on March 16, it had pierced the $21-trillion mark. At the end of September 2017, it was still $20.2 trillion. The flat spots in the chart below, followed by the vertical spikes, are the results of the debt-ceiling grandstanding in Congress:
These trillions are whizzing by so fast they’re hard to see. What was that, we asked? Where did that go?
Over the fiscal year, the gross national debt increased by 6.3% and now amounts to 105.4% of current-dollar GDP.
But this isn’t the Great Recession when tax revenues collapsed because millions of people lost their jobs and because companies lost money or went bankrupt as their sales collapsed and credit froze up; and when government expenditures soared because support payments such as unemployment compensation and food stamps soared, and because there was some stimulus spending too.
But no – these are the good times. Over the last 12-month period through Q2, the economy, as measured by nominal GDP grew 5.4%. “Nominal” GDP rather than inflation-adjusted (“real”) GDP because the debt isn’t adjusted for inflation either, and we want an apples-to-apples comparison.
The increases in the gross national debt have been a fiasco for many years. Even after the Great Recession was declared over and done with, the gross national debt increased on average by $954 billion per fiscal year from 2011 through 2017.
And the regular debt-ceiling fights in Congress, rather than accomplishing something noticeable in terms of fiscal rectitude, are just political charades that leave some flat spots in the chart above followed by some dizzying spikes right afterwards.
But now we have even more profligacy: Increased spending combined with tax cuts. As a result, the surge in the debt in fiscal 2018 of $1.27 trillion was 33% more than the already mind-blowing average surge in the debt over the past seven fiscal years ($954 billion).
For the first 11 months of fiscal 2018, through August, total tax receipts inched up by only $19 billion, or by 1%, according to the CBO, though the economy, as measured by nominal GDP, grew at an annual rate of about 5.4% (none of the figures are adjusted for inflation).
This 1% increase in revenues was distributed as is to be expected:
- Individual income and payroll tax receipts rose by $105 billion, or by 4%.
- Corporate income tax receipts fell by $71 billion, or by 30%, due to the new corporate tax law.
- Revenues from other sources fell by $16 billion or by 6%. This includes declines in the remittances from the Federal Reserve, which sends most of its profits to the Treasury Department, but now pays banks more on their excess reserves, and thus remits less to the Treasury Dept.
Outlays surged by $240 billion, or by 7%, over the first 11 months of fiscal 2018, compared to the same period in the prior year.
The CBO estimates that the “deficit” will be $895 billion in fiscal 2018. These annual “deficits,” based on government accounting, are almost always substantially smaller than the increase in the gross national debt. But it’s the debt that finally accounts for all the money the government spends minus the money it receives: The difference has to be borrowed, and that difference in fiscal 2018 between what it paid out what it received in revenues was $1.27 trillion.