Wolf Richter wolfstreet.com, http://www.amazon.com/author/wolfrichter
But these are still the good times.
Don’t blame the December debacle on the partial government shutdown – it “has not had a significant effect on December closings,” the National Association of Realtors explained in its report this morning. The shutdown started too late in December to have much of an impact. But it might impact January closings. So that will be interesting because December was bad enough.
Sales of “existing homes” — including single-family houses, townhouses, condos, and co-ops — in December, plunged 10.3% from a year earlier, to a seasonally adjusted annual rate (SAAR) of 4.99 million homes, according to the National Association of Realtors this morning. This was the biggest year-over-year drop since May 2011, during the throes of Housing Bust 1 (data via YCharts):
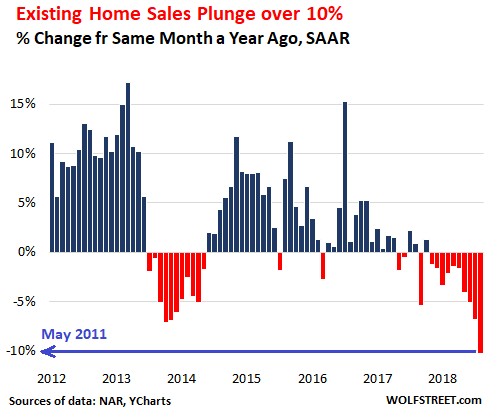
“The housing market is obviously very sensitive to mortgage rates,” the NAR said in the report. Mortgage rates ticked up from 4.2% in December 2017 for an average conforming 30-year fixed rate mortgage, to 5.2% at the peak in mid-November, according to the Mortgage Bankers Association. Then mortgage rates fell sharply and hit 4.75% by mid-December.
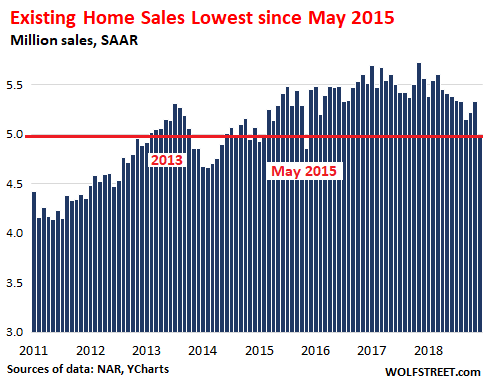
Analysts had expected a drop in home sales, but not that kind of drop. The median expectation, cited by the Wall Street Journal, was a drop from the November sales rate of 5.33 million to a December rate of 5.25 million. The drop to 4.99 million was sort of a wake-up call. It was the lowest since May 2015:
By category, sales of single-family houses in December plunged 10.1% from a year earlier to a seasonally adjusted annual sales rate of 4.45 million. Condo sales plunged 11.5% year-over-year to a rate of 540,000.
Note the accelerating drop in sales of existing homes in the Midwest and the unabated plunge in the West:
- Northeast: -6.8%, to an annual rate of 690,000.
- Midwest: -10.5%, to an annual rate of 1.19 million.
- South: -5.4%, to an annual rate of 2.09 million.
- West: -15.0%, to an annual rate of 1.02 million.
Total unsold housing inventory at the end of December stood at 1.55 million homes, up 6.2% from December 2017. That works out to be a supply of 3.7 months at the December sales rate, up from 3.2 months’ supply a year earlier. This measure of supply has been increasing for seven months in a row. And the average time properties stayed on the market jumped from 40 days a year ago to 46 days.
But this rising supply is still the wrong supply – it’s too darn expensive after years of rampant price increases, as NAR report said, “there is still a lack of adequate inventory on the lower-priced points and too many in upper-priced points.”
The market, if allowed to do its job, will fix that problem by bringing prices down across the board. And ever so gradually, averaged out across the country – with prices still soaring in some markets but falling in others – this is starting to happen.
Across the US, the median sales price – meaning that half of the homes sold for more and half sold for less — sill rose 2.9% year-over-year to $253,600, but it was the lowest growth rate since the price declines in early 2012:
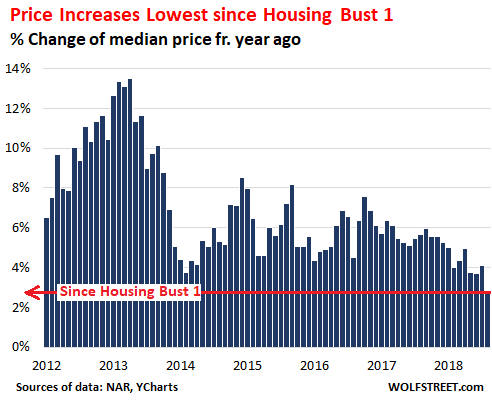
The median price in December was down 7.4% from June. June is usually the seasonal price peak in a given year. But the June-December decline in 2018 was the steepest since 2013. In 2017, the June-December decline was just 2.1%.
Median home prices by region:
- Northeast: rose 8.2% year-over-year, to $283,400.
- Midwest: flat year-over-year, at $191,300.
- South: rose 2.5% year-over-year, to $224,300.
- West: essentially flat (+0.2%) year-over-year, at $374,400.
The regional and national averages reflect everything mixed together. Prices are still rising sharply in some local housing markets. And they’re declining in others. These national numbers have begun to deteriorate because more local markets have begun to deteriorate. But it’s just a slow deterioration from what in many cities were very tight markets with ludicrously inflated prices.
Housing markets move slowly and normally play out over years. Big sudden moves even in local markets are rare. On a national basis, Housing Bust 1 took over five years to play out and was helped along by over 10 million job losses and a banking system that was teetering on the brink.
This housing downturn moved into the scene in 2018, a year when the economy was strong and created 2.6 million jobs. This downturn has been triggered by sky-high prices and rising mortgage rates, not by a recession or job losses. Those events – unavoidable as part of the business cycle – are still waiting in the wings.