Since Q2 2020, US homeowners have been big winners in terms of home price gains and equity in their homes. Unfortunately, this means that renters are big losers. Once again, The Federal Reserve is benefiting once segment of the population while punishing the other segment.

Homeowner Equity Q2 2021
*Homeownership mortgage source: 2016 American Community Survey.

National Homeowner Equity
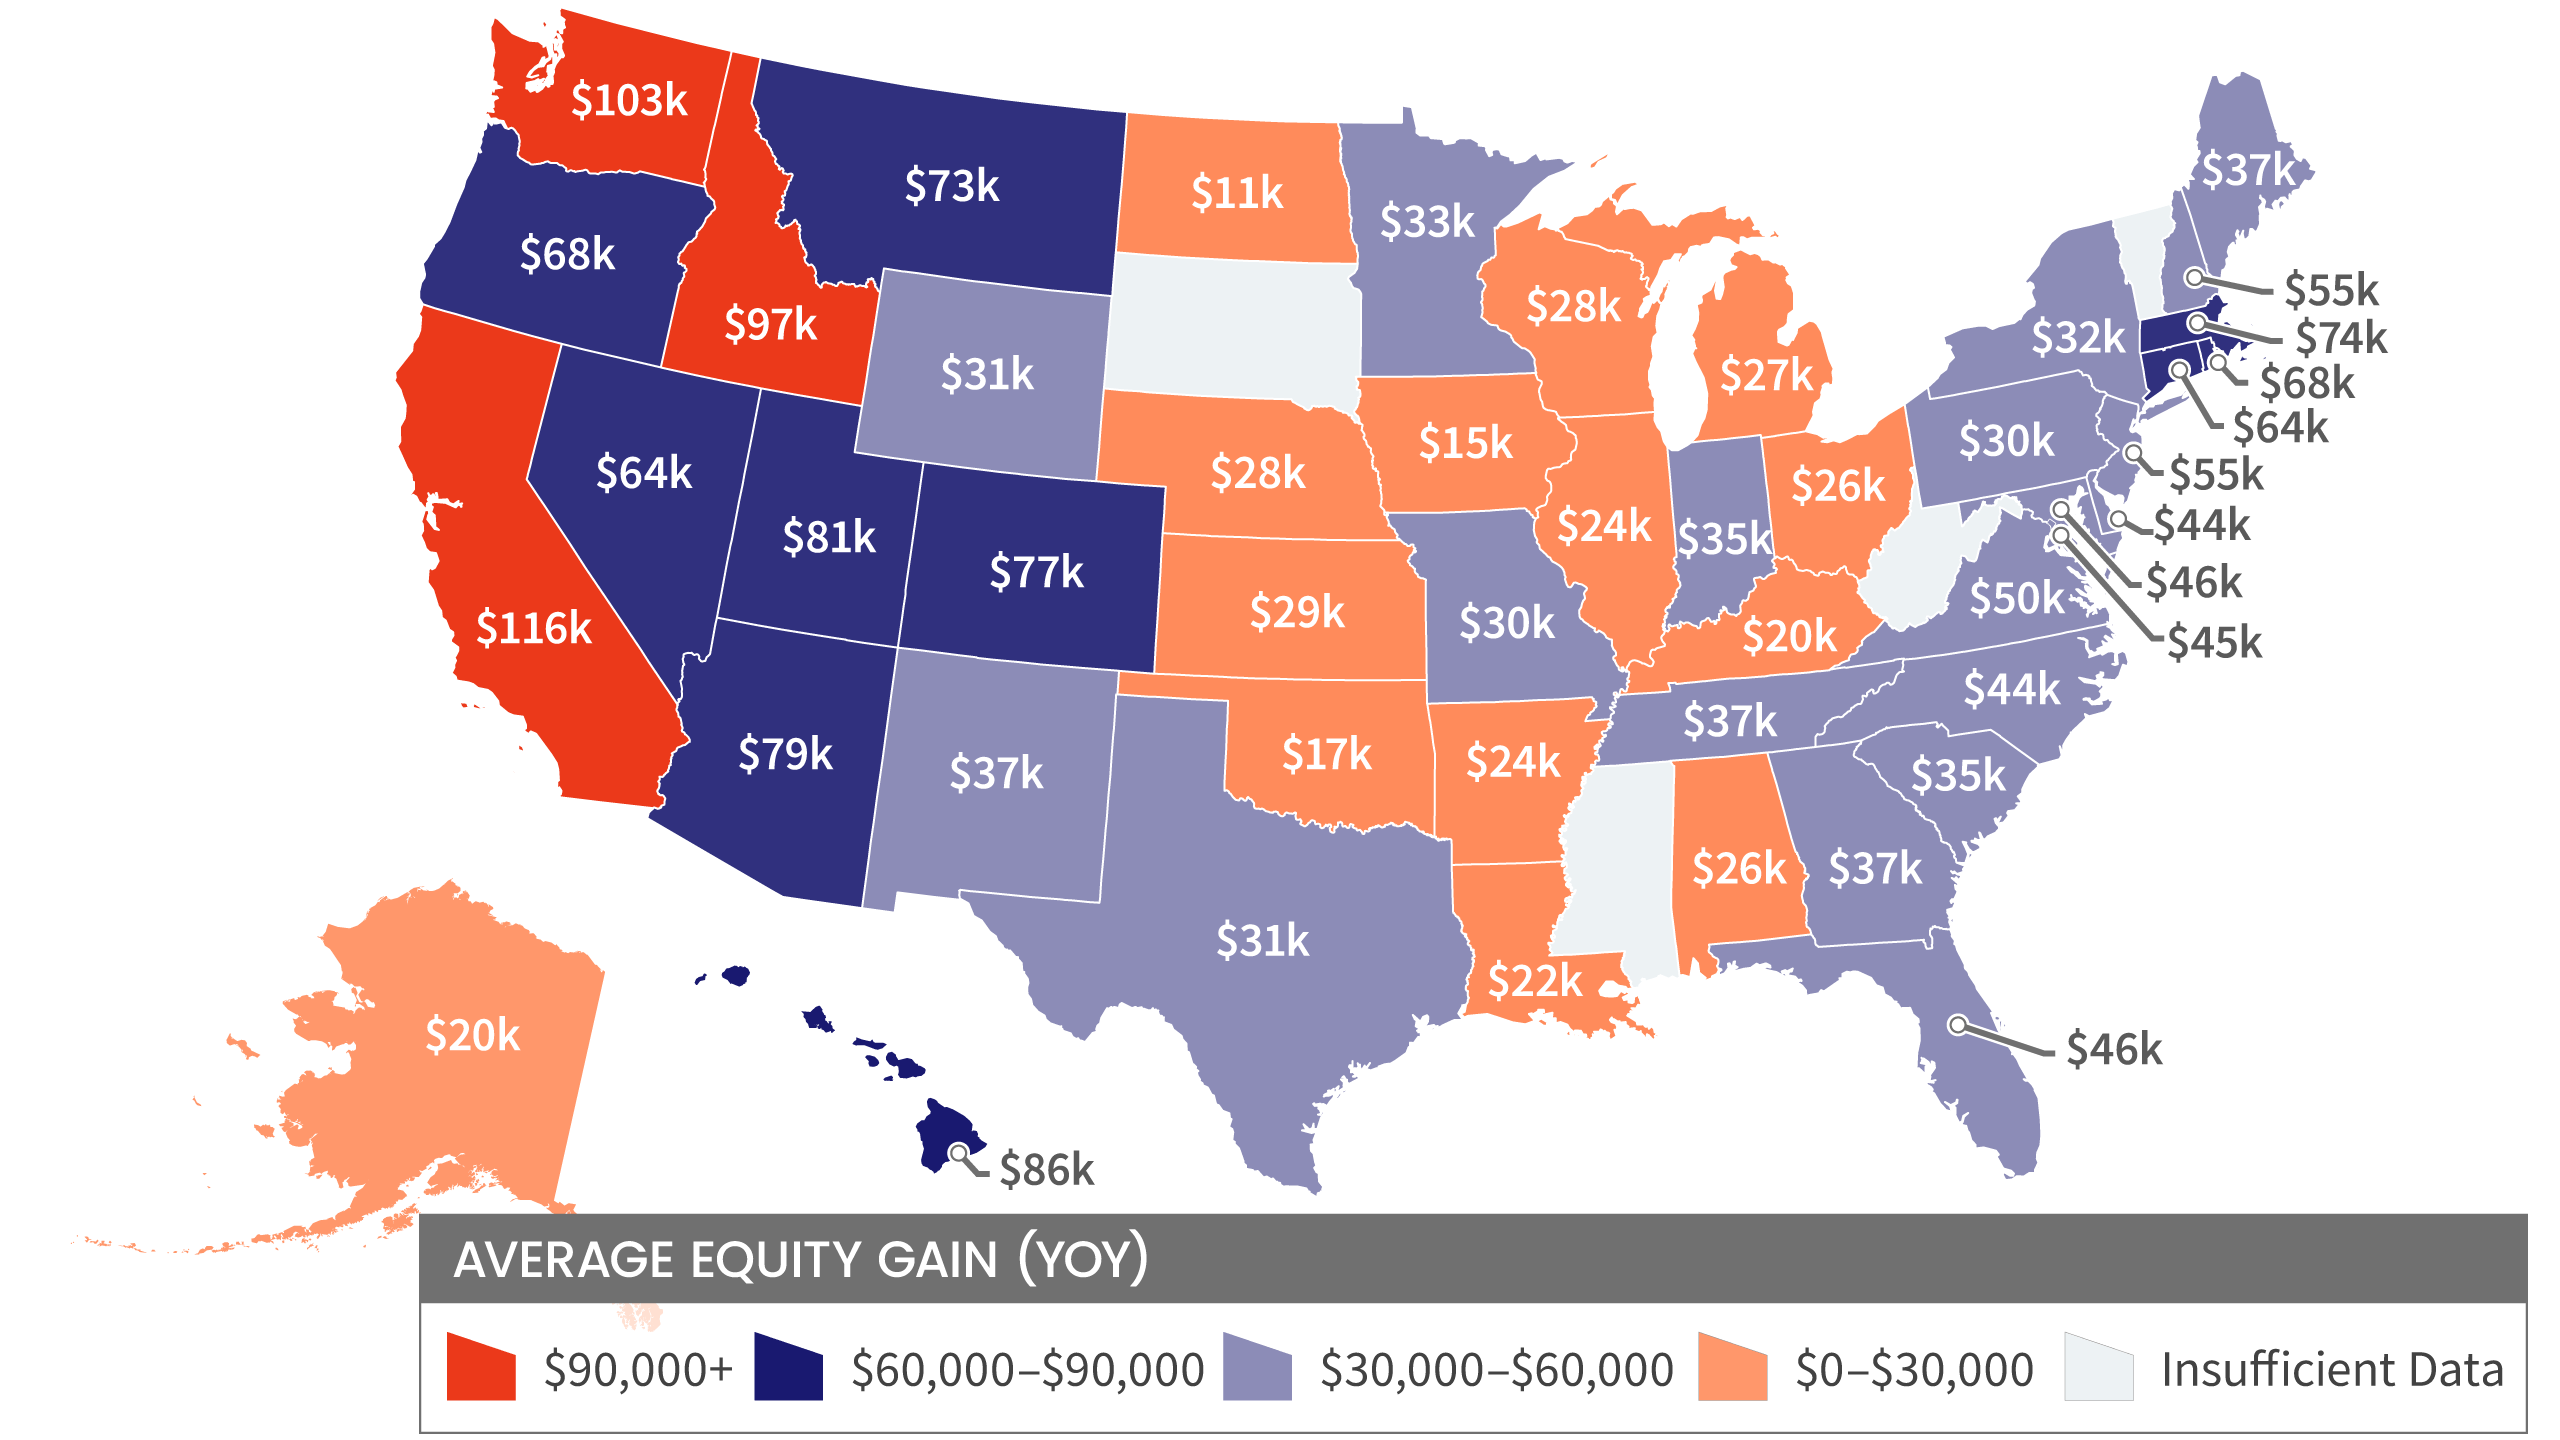
In the second quarter of 2021, the average homeowner gained approximately $51,500 in equity during the past year.
California, Washington, and Idaho experienced the largest average equity gains at $116,300, $102,900 and $97,000 respectively. Meanwhile, North Dakota experienced the lowest average equity gain in the second quarter of 2021 at $10,600.
10 Select Metros Change
CoreLogic provides homeowner equity data at the metropolitan level, in this graphic 10 of the largest cities, by housing stock are depicted.
Negative equity has seen a recent decrease across the country. San Francisco-Redwood City-South San Francisco, CA, is the least challenged, with Negative Equity Share of all mortgages at 0.6%.

Loan-to-Value Ratio (LTV)
The graph represents National Homeowner Equity Distribution across multiple LTV Segments.

Since growing home equity lead to lower default risk (or at least losses to the mortgage holder), we are seeing mortgage delinquencies fall after the Covid surge.

Of the top ten cities, Chicago leads in negative equity.
Maybe Fed Chair Jerome Powell is trying to soothe us, like Sam and Dave.