Source: Clive Maund for Streetwise Reports
Technical analyst Clive Maund explains why he believes the stock market rally of the past couple of weeks is not a resumption of the bull market.
This is a very timely point to remind ourselves that when the market broke down and plunged a few weeks ago, it did so from a parabolic blowoff top, or as we had defined it, a 4-arc Fan Ascent, which amounts to the same thing for practical purposes, a top that was accompanied by all oscillators and indicators being at record overbought extremes. While this top may not look all that extreme compared to something like Bitcoin, we should keep in mind that the broad US stock market is infinitely greater in magnitude than something like Bitcoin, and therefore vast amounts of capital are required to create any kind of parabolic blowoff. Given that there was a long lead in to this parabolic blowoff it means that the stock market is done—finished—and the bell has been rung on a new bear market.
Apparently the reason that the market got a bit of a boost yesterday was that there was talk going around that the Fed “realized the error of its ways,” and would backtrack on QT (Quantitative Tightening) and resume QE and happy days would be here again. There’s only one problem with that argument, and it’s a big one, which is that if they try to resume that course in the face of gargantuan and fast rising deficits, they will crash the dollar and send rates through the roof, causing the economy to implode anyway. So, to use a rather hackneyed old expression, they are caught between a rock and hard place, they can no longer have their cake and eat it, and its payback time as all their financial crimes of extreme profligacy for years on end finally catch up with them, and unfortunately, the rest of us. Going back to QE just won’t work and that means the jig is up on this bull market, which, of course, is what we would expect after a parabolic blowoff top.
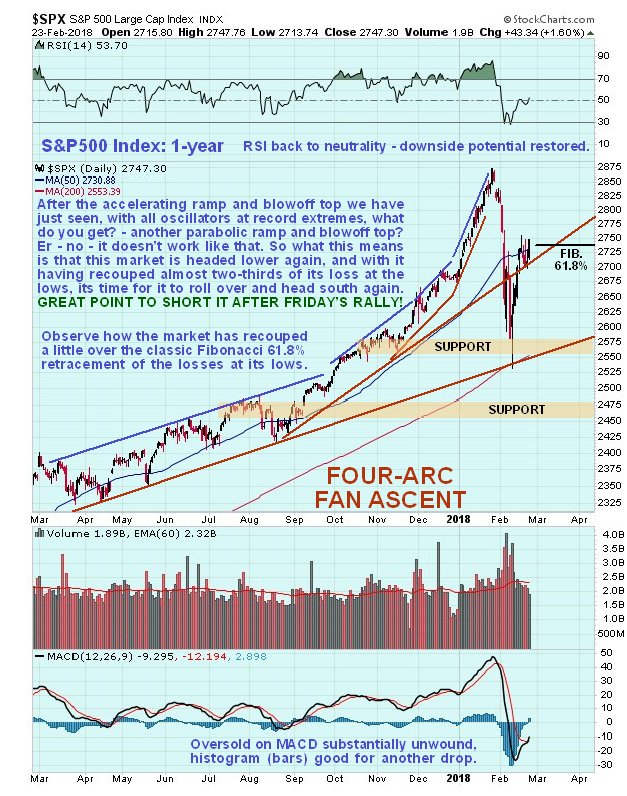
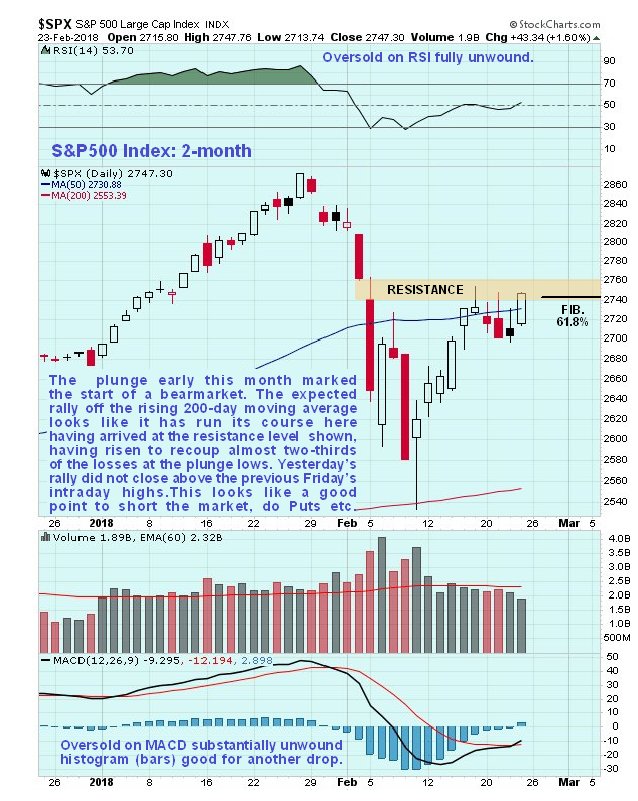
So how is the market looking now on the charts? You may recall that we called the top of the market within a week, and then the bottom of the plunge right after it occurred, when we closed out all Puts. A few days back we called the top for this rebound and put money on it but thanks to yesterday’s rather sharp rally, folks may be wondering if that call is wrong—is it? Let’s now examine the latest 1-year chart for the S&P500 index to see how things look.
The 1-year chart is very useful as it enables us to put the rebound of the past couple of weeks in the context of the 4-arc Fan Ascent into the bull market peak and the plunge that followed. Given that, as we have noted above, parabolic blowoff tops coming at the end of a long bull market are just that, tops, and are not corrections or consolidations as the government and Wall St are trying to make out, it means that this rebound is nothing more than a bear market rally to correct a deeply oversold condition, that should not make it back to the highs. This rebound was in order and we expected it, because the market had plunged into a still steeply rising 200-day moving average, which meant that the rebound would be sizable, and it has been. Since the top is in and a bear market has started, the maximum rebound to be expected was just under two-thirds of the preceding drop, or Fibonacci 61.8% to be precise, which is why we shorted it by buying bear ETFs last week when it recouped this percentage, since which time the market has risen marginally above this target level as can be seen on the chart, but interestingly yesterday’s rally did not succeed on closing above the intraday high of the previous Friday. Thus the market should turn lower here or very soon and we are believed to be at a great point to short it.

Clive Maund has been president of http://www.clivemaund.com, a successful resource sector website, since its inception in 2003. He has 30 years’ experience in technical analysis and has worked for banks, commodity brokers and stockbrokers in the City of London. He holds a Diploma in Technical Analysis from the UK Society of Technical Analysts.
Apparently the reason that the market got a bit of a boost yesterday was that there was talk going around that the Fed “realized the error of its ways,” and would backtrack on QT (Quantitative Tightening) and resume QE and happy days would be here again. There’s only one problem with that argument, and it’s a big one, which is that if they try to resume that course in the face of gargantuan and fast rising deficits, they will crash the dollar and send rates through the roof, causing the economy to implode anyway. So, to use a rather hackneyed old expression, they are caught between a rock and hard place, they can no longer have their cake and eat it, and its payback time as all their financial crimes of extreme profligacy for years on end finally catch up with them, and unfortunately, the rest of us. Going back to QE just won’t work and that means the jig is up on this bull market, which, of course, is what we would expect after a parabolic blowoff top.
So how is the market looking now on the charts? You may recall that we called the top of the market within a week, and then the bottom of the plunge right after it occurred, when we closed out all Puts. A few days back we called the top for this rebound and put money on it but thanks to yesterday’s rather sharp rally, folks may be wondering if that call is wrong—is it? Let’s now examine the latest 1-year chart for the S&P500 index to see how things look.
The 1-year chart is very useful as it enables us to put the rebound of the past couple of weeks in the context of the 4-arc Fan Ascent into the bull market peak and the plunge that followed. Given that, as we have noted above, parabolic blowoff tops coming at the end of a long bull market are just that, tops, and are not corrections or consolidations as the government and Wall St are trying to make out, it means that this rebound is nothing more than a bear market rally to correct a deeply oversold condition, that should not make it back to the highs. This rebound was in order and we expected it, because the market had plunged into a still steeply rising 200-day moving average, which meant that the rebound would be sizable, and it has been. Since the top is in and a bear market has started, the maximum rebound to be expected was just under two-thirds of the preceding drop, or Fibonacci 61.8% to be precise, which is why we shorted it by buying bear ETFs last week when it recouped this percentage, since which time the market has risen marginally above this target level as can be seen on the chart, but interestingly yesterday’s rally did not succeed on closing above the intraday high of the previous Friday. Thus the market should turn lower here or very soon and we are believed to be at a great point to short it.
Clive Maund has been president of http://www.clivemaund.com, a successful resource sector website, since its inception in 2003. He has 30 years’ experience in technical analysis and has worked for banks, commodity brokers and stockbrokers in the City of London. He holds a Diploma in Technical Analysis from the UK Society of Technical Analysts.