by howmuch
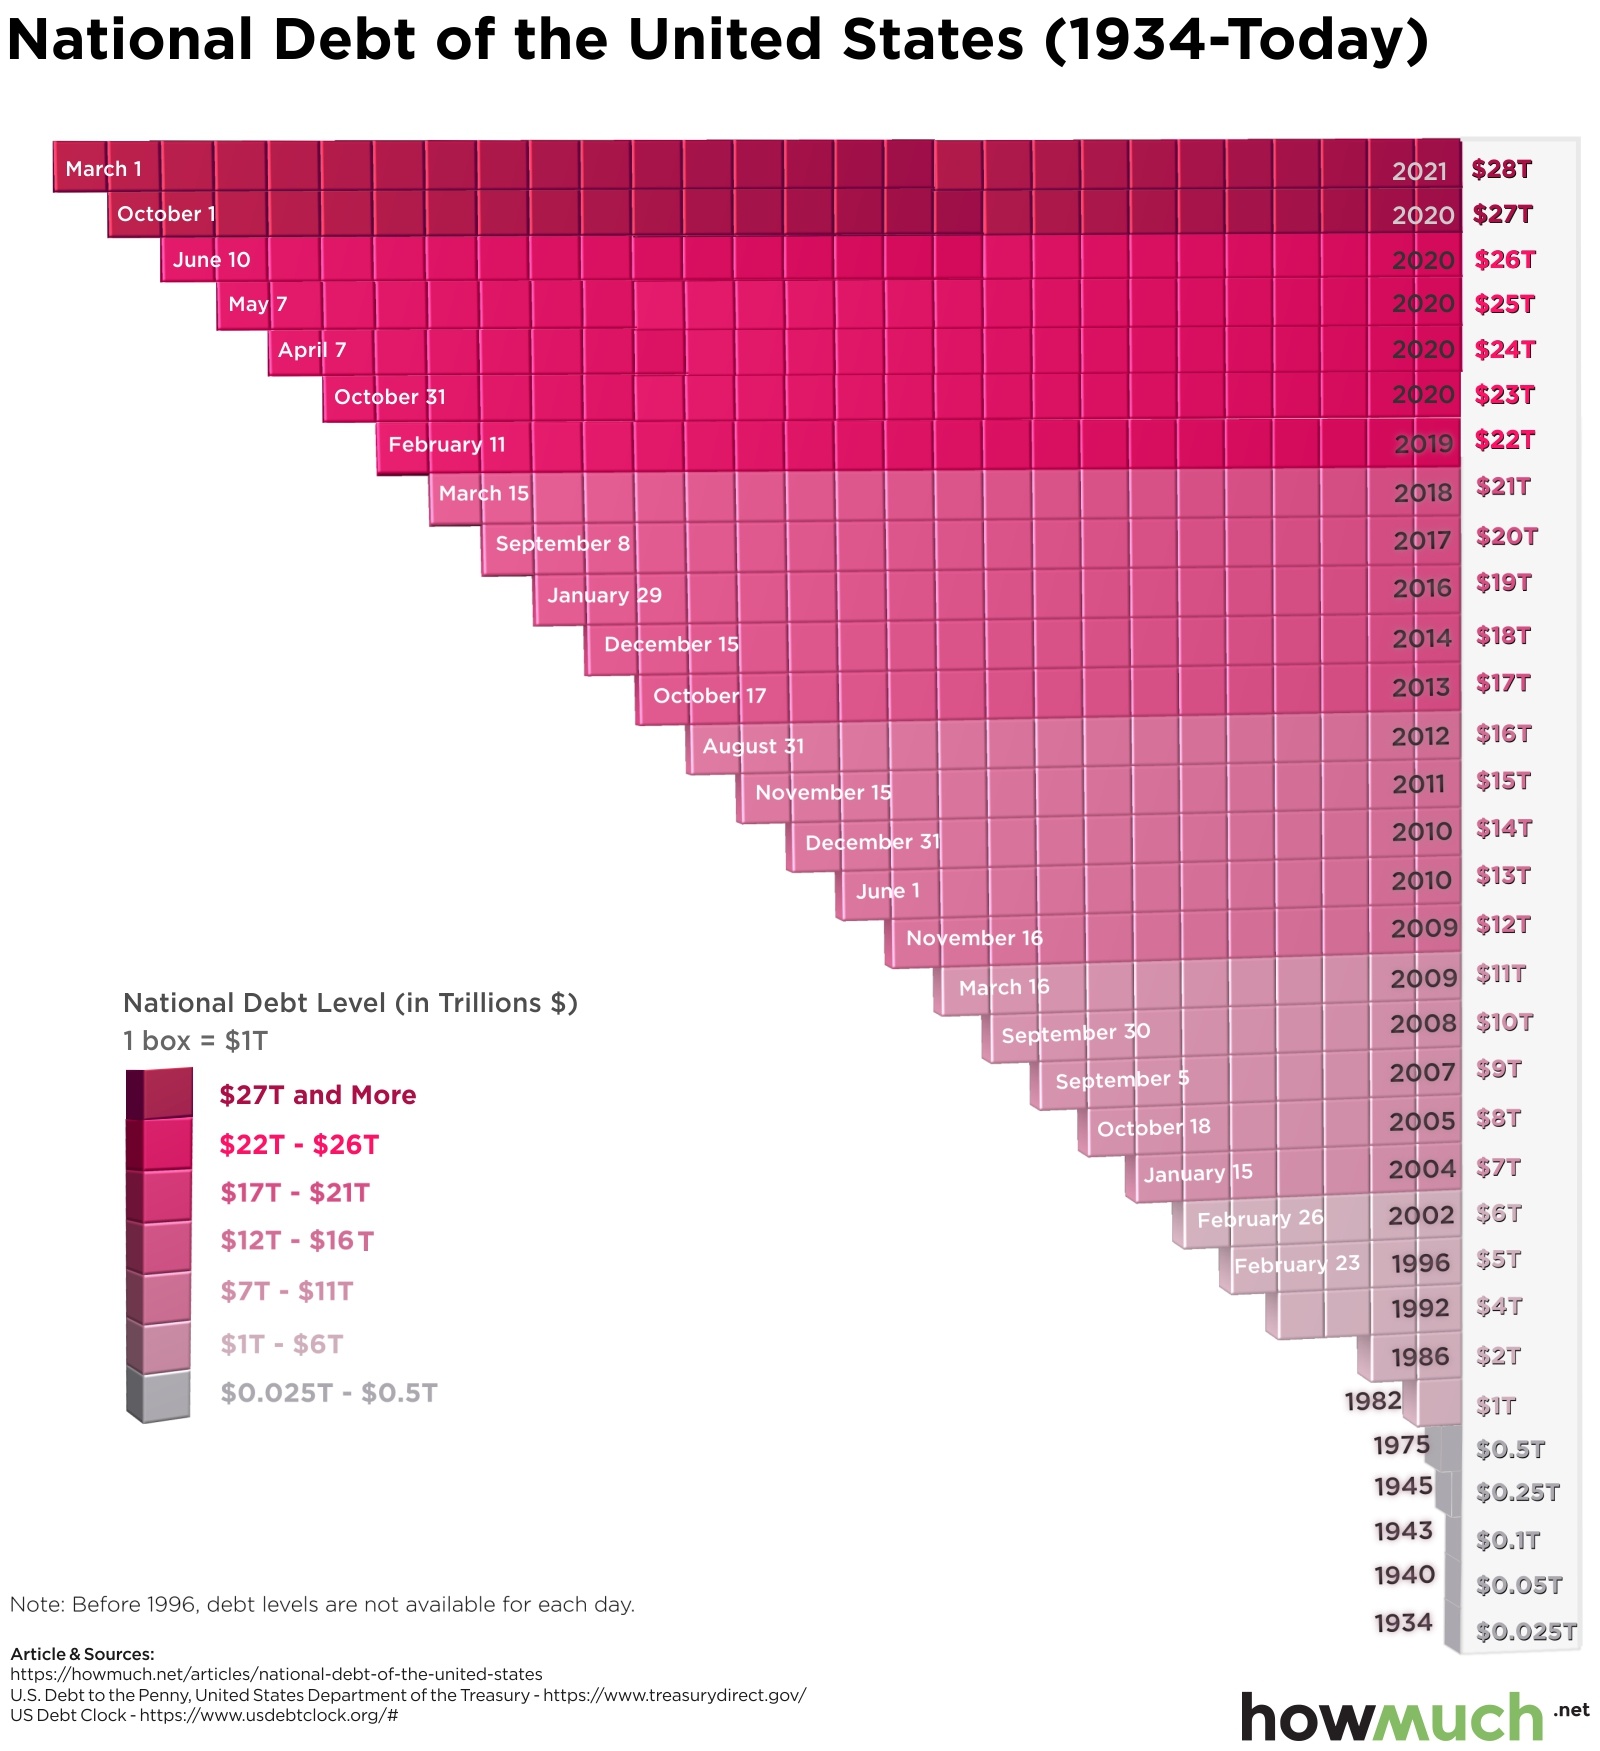
In March 2021, the national debt hit an eye-popping $28 trillion, coming off the back of a $2.2 trillion stimulus passed by the U.S. Congress last year and prospects for another one in the coming months. The Congressional Budget Office expects national debt to double to 202% of GDP by 2051. You can check out the U.S. debt clock in real-time here.

Recently, The Balance published an article noting major milestones in the accumulation of national debt, using data from the ”U.S. Debt to the Penny” report from the United States Department of the Treasury. We used the information compiled by The Balance to create our latest visualization, which shows how much the national debt has grown since 1934. Prior to 1996, the visualization only uses years but not the exact dates because debt levels are not available for each day. Each box in the visualization is equal to $1 trillion.
In 1934, the national debt was only $25 billion. It began increasing rapidly in the 1980s, reaching $1 trillion in 1982 and ballooning throughout the 1990s and 2000s.
Just as with household debt, the national debt increases when spending outpaces revenue. In the case of the government, the majority of revenue comes from taxes levied on personal and corporate income. To amass more funds (which results in accruing debt), the federal government issues treasury bills, notes, and bonds to creditors.
The national debt is composed of two main categories: intragovernmental debt and debt held by the public. Intragovernmental debt is held by federal agencies, such as the Social Security Trust Fund and Medicare. For debt held by the public, the creditors are individuals, corporations, state or local governments, Federal Reserve Banks, foreign governments, and other entities outside the United States government. About two-thirds of the national debt is classified as debt held by the public.
Acquiring too much debt can have a negative effect on a number of economic factors, including slower economic growth, lower stock market returns, and decreased confidence in the U.S. government’s ability to repay its debt. Currently, the debt-to-GDP ratio in the U.S. is 127%, above the World Bank’s recommendation of 77%. The higher the ratio, the greater the risk of default. This makes it more imperative than ever to rein in the national debt and get the government’s “checkbook” under control.
Looking for another perspective of the national debt? Here’s our visualization on how the national debt has grown under each president.