
Since 2009, U.S. stocks have sustained the longest bull market in modern history, with the S&P 500 rising by 400%.
Dubbed the “Long, Slow Recovery”, its name can be taken quite literally. At 131 months and counting, it’s the longest of its kind by a margin of 18 months. It’s also one of the slowest growing bull markets in history, compounding at a 16% compound annual growth rate (CAGR).
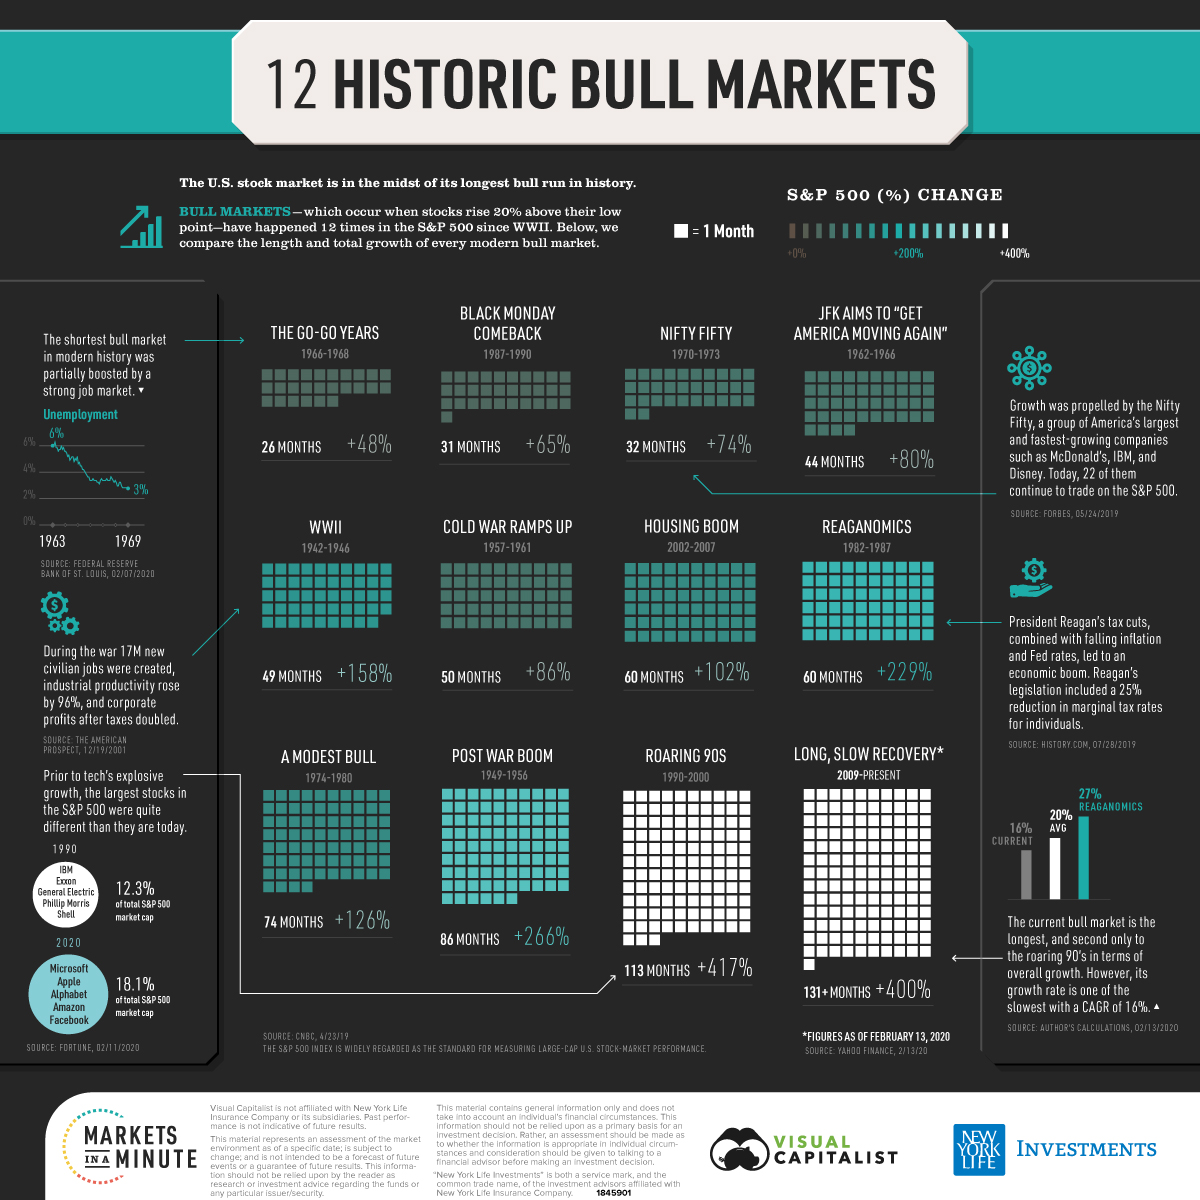
Today’s Markets In A Minute chart comes from New York Life Investments, which illustrates the length and growth of every U.S. bull market since World War II. From this, we can begin to recognize that bull markets vary quite significantly.
Tale of the Tape
Bull markets—which occur when stocks rise 20% above their low point—have happened 12 times in the S&P 500 since World War II. Here’s how they compare to one another.
| Name | Length (months) |
Total S&P 500 Change (%) | Compound Annual Growth Rate (CAGR) |
|---|---|---|---|
| World War II (1942-1946) | 49 | 158% | 26% |
| Post-war Boom (1949-1956) | 86 | 266% | 20% |
| Cold War Ramps Up (1957-1961) | 50 | 86% | 16% |
| JFK Aims to “Get America Moving Again” (1962-1966) | 44 | 80% | 17% |
| The Go-go Years (1966-1968) | 26 | 48% | 20% |
| Nifty Fifty (1970-1973) | 32 | 74% | 23% |
| A Modest Bull (1974-1980) | 74 | 126% | 14% |
| Reaganomics (1982-1987) | 60 | 229% | 27% |
| Black Monday Comeback (1987-1990) | 31 | 65% | 21% |
| Roaring 90s (1990-2000) | 113 | 417% | 19% |
| Housing Boom (2002-2007) | 60 | 102% | 15% |
| Long, Slow Recovery* (2009-Present) | 131 | 400% | 16% |
*Figures are as of Feb. 13, 2020
Source: CNBC, Yahoo Finance
Different Recipe, Same Result
History has shown us that bull markets can arise from a variety of scenarios. Here’s how some of the most significant ones came to fruition.
World War II (1942-1946)
Following the attack on Pearl Harbor, America mobilized for war. As government spending climbed, several agencies were established to regulate and control the economy.
These measures led to the creation of 17 million jobs, and brought the U.S. unemployment rate to a record low of just 1.2%. While corporate profits after taxes doubled, income grew for virtually all Americans—manufacturing workers, for example, saw their real incomes rise by nearly a quarter from 1940 to 1945.
It is for these reasons, among others, that the World War II bull market boasts a 26% CAGR, one of the largest in modern history.
Reaganomics (1982-1987)
The bull market of 1982 to 1987 was ushered in by Ronald Reagan’s Economic Recovery Tax Act (ERTA), a historic set of policies based on “supply-side economics”, now famously known as Reaganomics.
Supply-side economics are based on the theory that reducing taxes incentivizes individuals and businesses to produce more. Thus, the ultimate goal of ERTA was to encourage American innovation and entrepreneurship. In practice, this meant reducing marginal tax rates—the top marginal tax rate fell from 70% to 50%, while the lowest rate fell from 14% to 11%.
These cuts were a powerful ingredient for the making of another bull market. The S&P 500 grew by 229% over 60 months, resulting in a record-breaking CAGR of 27%.
Roaring 90s (1990-2000)
Yet another appropriately named bull market, the Roaring 90s lasted an impressive 113 months and generated a mammoth 417% total gain in the S&P 500—the largest in history.
While overall economic growth was robust, the focal point of this bull market was the beginningof the Internet Age and emergence of dot-com companies. Despite weak fundamentals and high valuations, investors poured money into internet startups with high hopes of long-run profitability.
Looking Into The Crystal Ball
While it’s inevitable that the “Long, Slow Recovery” will one day come to an end, this record-breaking bull market has so far proven us wrong. For example, in 2016, a multivariate model designed by economists at JP Morgan predicted the chance of recession within three years to be 92%.
Perhaps this prediction was off because the market environment today is so fundamentally different. With the advent of big tech, five companies now comprise 18% of the S&P 500. Collectively, these five companies (Microsoft, Apple, Google, Amazon and Facebook) have seen their market capitalizations grow by nearly $5 trillion since 2013.
Regardless of what happens, one thing is true: markets will continue to surprise us.