via visualcapitalist:
View the full-size version of this infographic.
What do Equifax, Yahoo, and the U.S. military have in common? They’ve all fallen victim to a cyberattack at some point in the last decade—and they’re just the tip of the iceberg.
Today’s infographic from Raconteur delves into the average damage caused by cyberattacks at the organizational level, sorted by type of attack, industry, and country.
Rising Cybercrime Costs Across the Board
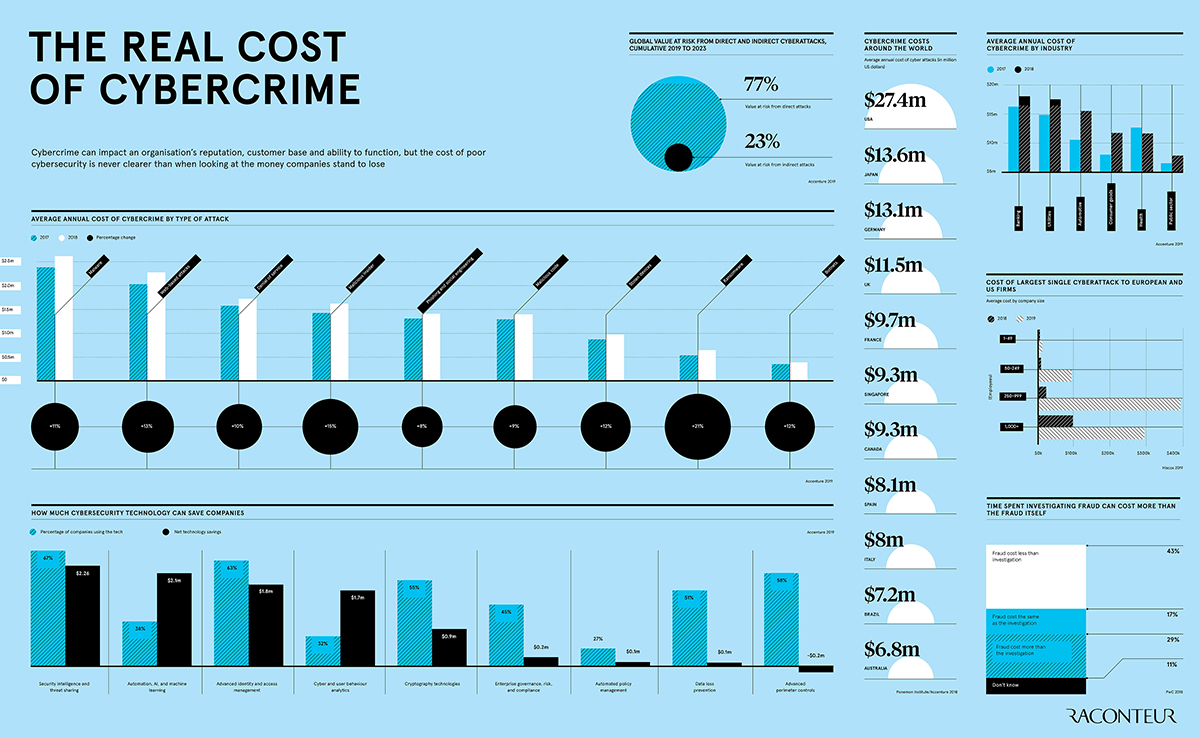
The infographic focuses on data from the latest Accenture “Cost of Cybercrime” study, which details how cyber threats are evolving in a fast-paced digital landscape.
Overall, the average annual cost to organizations has been ballooning for all types of cyberattacks. For example, a single malware attack in 2018 costed more than $2.6 million, while ransomware costs rose the most between 2017–2018, from $533,000 to $646,000 (a 21% increase).
Both information loss and business disruption occurring from attacks have been found to be the major cost drivers, regardless of the type of attack:
- Malware
Major consequence: Information Loss
Average cost: $1.4M (54% of total losses) - Web-based attacks
Major consequence: Information Loss
Average cost: $1.4M (61% of total losses) - Denial-of-Service (DOS)
Major consequence: Business Disruption
Average cost: $1.1M (65% of total losses) - Malicious insiders
Major consequences: Business Disruption and Information Loss
Average cost: $1.2M ($0.6M each, 75% of total losses)
In 2018, information loss and business disruption combined for over 75% of total business losses from cybercrime.
Cybercrime Casts a Wide Net
No industry is untouched by the growing cost of cybercrime—the report notes that organizations have seen security breaches grow by 67% in the past five years alone. Banking is the most affected, with annual costs crossing $18 million in 2018. This probably comes as no surprise, considering that financial motives are consistently a major incentive for hackers.
Here is the average cost of cyberattacks (per organization) across 15 different industries:
| Industry | 2017 Cost | 2018 Cost | % Change |
|---|---|---|---|
| Banking | $16.6M | $18.4M | +11% |
| Utilities | $15.1M | $17.8M | +18% |
| Software | $14.5M | $16M | +11% |
| Automotive | $10.7M | $15.8M | +47% |
| Insurance | $12.9M | $15.8M | +22% |
| High tech | $12.9M | $14.7M | +14% |
| Capital markets | $10.6M | $13.9M | +32% |
| Energy | $13.2M | $13.8M | +4% |
| U.S. Federal | $10.4M | $13.7M | +32% |
| Consumer goods | $8.1M | $11.9M | +47% |
| Health | $12.9M | $11.8M | -8% |
| Retail | $9M | $11.4M | +26% |
| Life sciences | $5.9M | $10.9M | +86% |
| Media | $7.6M | $9.2M | +22% |
| Travel | $4.6M | $8.2M | +77% |
| Public sector | $6.6M | $7.9M | +20% |
Interestingly, the impact on life sciences companies rose the most in a year (up by 86% to $10.9 million per organization), followed by the travel industry (up 77% to $8.2 million per organization). This is likely due to an increase in sensitive and valuable data being shared online, such as clinical trial details or credit card information.
So What Can Companies Do?
Accenture analyzed nine cutting-edge technologies that are helping mitigate cybercrime, and calculated their net savings: the total potential savings minus the required investment in each type of technology or tool.
With almost $2.3 million in net savings, many companies recognize the high payoff that comes with security intelligence. On the other hand, leveraging automation, artificial intelligence, and machine learning can potentially save over $2 million—however, only 38% of businesses have adopted this solution so far.
Cybercrime will remain a large-scale concern for years to come. From 2019–2023E, approximately $5.2 trillion in global value will be at risk from cyberattacks, creating an ongoing challenge for corporations and investors alike.