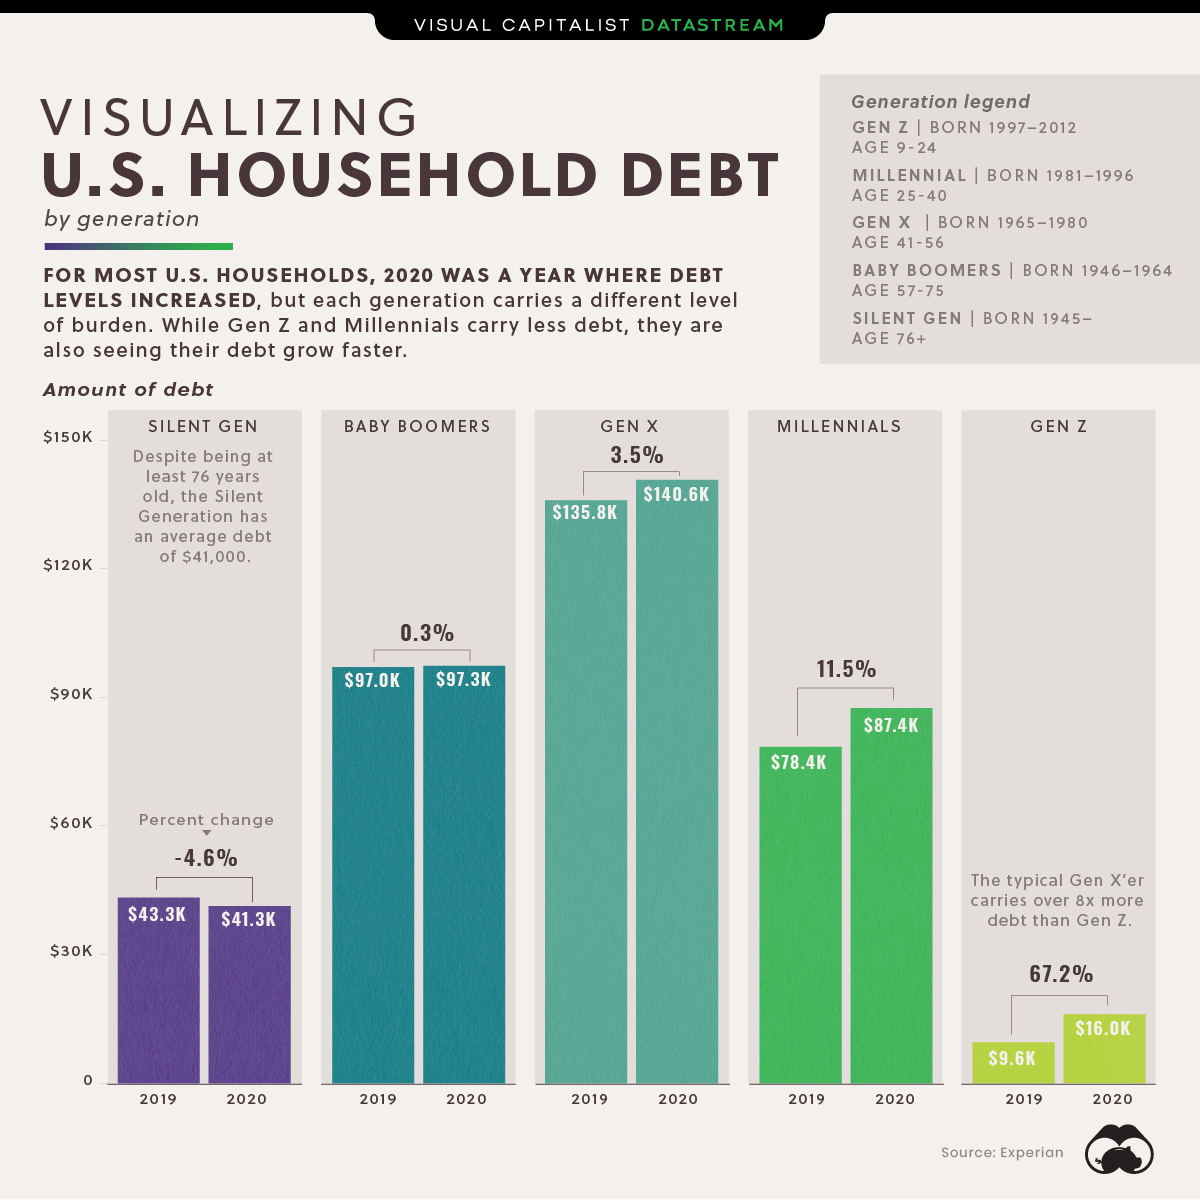
The year 2020 could be categorized as one where debt grew across the board. In the U.S., every generation except the Silent Generation saw their debts rise in the last year.
But how much debt does each generational household owe?
Gen X are the most indebted Americans followed by the Baby Boomers. The breakdown of debt by age group suggests the typical American’s debts grow with adulthood to a certain age, at which point it begins to taper off.
Download the Generational Power Report (.pdf)

Digging Deeper
The types of debt vary in significance for each generation. For instance, the leading source of debt for Gen Z and Millennials are student loans (20%) and credit card bills (25%), respectively. Mortgages on the other hand, are the leading source of debt for Gen X (30%) and Baby Boomers (28%).
Collectively, American households have a debt pile of $14.5 trillion, with mortgages representing the majority, at 70%.
Here’s how home mortgages by generation breaks down.
| Generation | Portion of Mortgage Debt |
|---|---|
| Silent Generation | 4.8% |
| Baby Boomers | 29.0% |
| Generation X | 42.0% |
| Millennials | 24.2% |
| Generation Z | – |
Given mortgages represent the largest slice and that Gen X is the most indebted household, it stands to reason that at 42%, Gen X carries the most mortgage debt out of any generation.
Editor’s note: It should be mentioned that the Federal Reserve is yet to include Gen Z in some of their data.
Zooming Out
Though debts are rising for most U.S. households, they still pale in comparison to other countries. Here’s how household U.S. debt ranks on the international stage.
| Country / Territory | Household Debt to GDP (September 2020) |
|---|---|
| 🇨🇭 Switzerland | 131% |
| 🇦🇺 Australia | 122% |
| 🇳🇴 Norway | 112% |
| 🇩🇰 Denmark | 112% |
| 🇨🇦 Canada | 110% |
| 🇳🇱 Netherlands | 104% |
| 🇰🇷 South Korea | 101% |
| 🇳🇿 New Zealand | 95% |
| 🇸🇪 Sweden | 93% |
| 🇬🇧 United Kingdom | 89% |
| 🇭🇰 Hong Kong SAR | 88% |
| 🇺🇸 U.S. | 78% |
The U.S. ranks 12th in global household debt to GDP rankings.
In addition to being the largest economy by GDP, America’s GDP per capita remains one of the highest out of major countries, suggesting these high debts by generation are in part offset by high incomes.
Looking Ahead
Increasing debts have been manageable due to a low interest rate environment. This has persisted for well over a decade, and is expected to remain the case for the near future.
Whether this can hold steady in the long run is still largely unknown.