by Dana Lyons

This is the first in a mini-series look at some unusual behavior we’re observing in the S&P 500 Volatility Index, aka, the VIX.
It’s been more than 2 years since the VIX recorded a 52-week low; what is that telling investors, especially with stocks sitting at all-time highs?
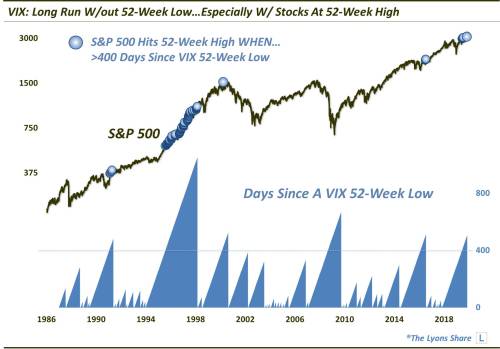
Generally, when stocks move higher, the S&P 500 Volatility Index, aka, the VIX, moves lower. That’s what makes today’s Chart Of The Day so surprising. It shows that, despite the upward trajectory of the U.S. stock market in recent years, the VIX has been unable to record a 52-week low in awhile – a historically long while. Specifically, it has now been more than 2 years since the VIX closed at a 52-week low. That’s just the 5th streak of at least 2 years since the inception of the VIX.
It is especially unusual given the fact that the stock market, at least the S&P 500, is trading at all-time highs. There have been just 4 other unique streaks of even 400 days without a VIX new low that saw the S&P 500 trade at a 52-week high.
So what, if anything, is this unusual VIX behavior telling us? Is the divergence a cause for concern? Or is it a random piece of inane market data? We break down the data from a historical perspective in a Premium Post at The Lyons Share, revealing to members our takeaway from this unusual signal – and the appropriate investment action to take. Also, stay tuned for more peculiar observations from the VIX market later this week.