
by Dana Lyons

This is the third in a mini-series look at some unusual behavior we’re observing in the S&P 500 Volatility Index, aka, the VIX (on 11/19, we looked at the VIX’s historic streak without hitting a 52-week low and on 11/20, we looked at the abundance of 52-week highs in the S&P 500 since the last VIX low).
The S&P 500 has recorded a flurry of 52-week highs recently, many of which oddly saw the VIX rise as well; is this behavior sending a message to investors?
As we mentioned the other day, when stocks move higher, the S&P 500 Volatility Index, aka, the VIX, generally moves lower. That relationship doesn’t always hold, however, and we have seen an extreme example of counter behavior just recently.
Since its recent breakout, the S&P 500 (SPX) has put up a spree of new 52-week highs – 10 of them, in fact, in the past month. Of those 10, 6 of them also saw the VIX close higher on the day. As our Chart Of The Day illustrates, that’s one of the largest clusters of such events in the history of the VIX.
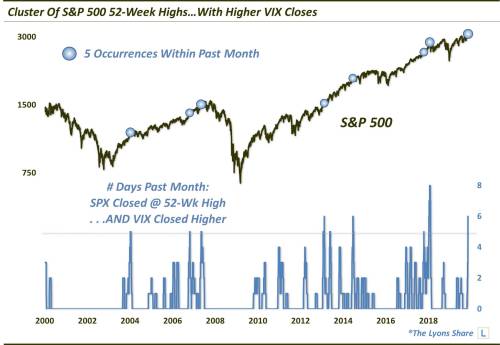
As the chart indicates, it has been relatively rare to see even clusters of 5 such days over the past 20 years. But is there a message behind this data point? Further, is the message a cautionary one?
Well, it is worth noting that the last cluster of events this large (actually, a record 8-day cluster) occurred right at the January 2018 top in the S&P 500. Prior to that, we also observe a similar cluster in May 2007 which essentially marked the top of the broad U.S. stock market for about the next 6 years.
With that said, there have also been as many clusters in the past 20 years that did not led to tumultuous stock market performance. Furthermore, it’s not shown on this chart, but the rising stock-rising volatility period during the mid to late-1990′s also saw several such clusters. And outside of one prior to the sharp 1998 correction, they did not precede anything too worrisome in the stock market either.
So what’s the takeaway here? The historical evidence is a mixed bag, more so than the prior signals we’ve looked at in this VIX series. It is something to be aware of. However, it certainly isn’t going to supersede our quantitative models in generating investment decisions for us (nothing does).