Gig workers weigh. PUA and “Initial Claims” surge. But millions of other workers got their jobs back. Here are the “Insured Unemployment Rates” for each state, topping out at 30%.
By Wolf Richter for WOLF STREET.
Has the collapse of the US labor market finally bottomed out? It would have to stop getting worse first. After it stops getting worse, it might begin to recover. And there are signs that the labor market might be approaching that bottom, but the overall numbers are still getting a lot worse.
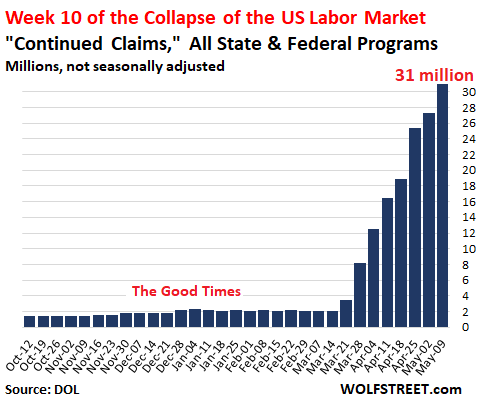
The number of people who filed for unemployment insurance in or before the week ended May 9 under all state and federal unemployment insurance programs combined, including Pandemic Unemployment Assistance (PUA) for gig workers and programs for laid-off federal employees, and who still don’t have a job, surged by 3.68 million people in the week (not seasonally adjusted), the US Department of Labor reported this morning. They’ve now reached a gut-wrenching record of 30.96 million:
Gig workers weigh heavily.
The number of initial claims by gig workers who are now eligible to file under the federal unemployment insurance program Pandemic Unemployment Assistance (PUA), and who are not eligible to file under state programs, jumped by 1.19 million (not seasonally adjusted) in the week ended May 23.
The number of gig workers who’d initially filed PUA claims through the week ended May 9 and who are still not working, has now surged to 7.8 million (not seasonally adjusted).
There are still well over a dozen states – including the big one, Florida – that have not yet started processing PUA claims. And when they finally figure out how to do it, those claims will add large lumps to the total, and we can expect to see large catch-up numbers in the future, reflecting gig workers who’ve lost their gigs in late March or April.
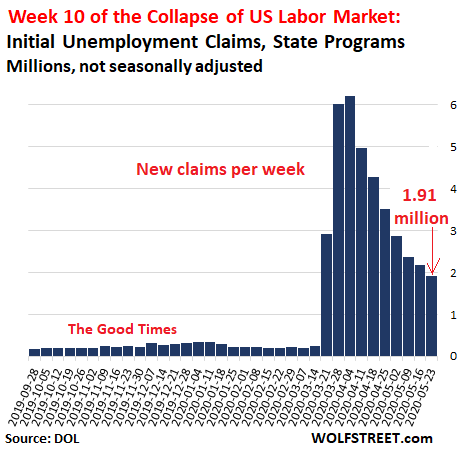
New claims under state programs surge at gut-wrenching pace.
In the week ended May 23, about 1.91 million workers filed initial unemployment claims under state programs (not seasonally adjusted). This means the layoffs are still proceeding at a previously unimaginable pace, at three times the magnitude of the prior weekly records during the unemployment crises in 1982 and 2009:
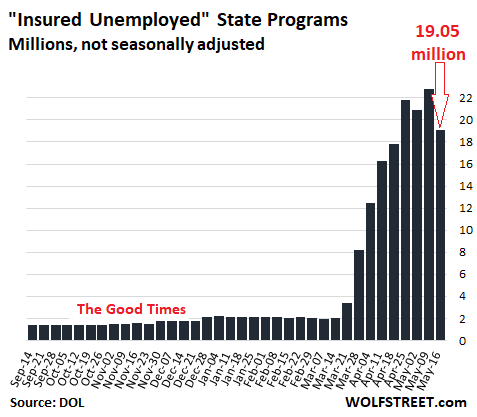
But millions of previously laid-off people got hired back.
And this is where the first signs of a bottom in the collapse of the labor market come into view. The number of “insured unemployed” – the people who’d filed for state unemployment insurance in or before the week ended May 16 and still haven’t found a job – dropped by 3.74 million to 19.05 million “continued claims” (not seasonally adjusted). This means that millions of people who’d received state unemployment insurance have been hired back:
The 28 states with the most “initial claims.”
These are the initial claims filed in the week ended May 23 under state programs and do not include claims under federal programs, such as PUA claims:
| Top 28 States, Initial Claims in the week ended May 23 | ||
| 1 | California | 212,343 |
| 2 | New York | 192,193 |
| 3 | Florida | 173,731 |
| 4 | Georgia | 164,350 |
| 5 | Texas | 128,105 |
| 6 | Pennsylvania | 69,408 |
| 7 | Virginia | 58,591 |
| 8 | Illinois | 58,359 |
| 9 | Michigan | 57,714 |
| 10 | Kentucky | 53,738 |
| 11 | Washington | 53,280 |
| 12 | North Carolina | 43,221 |
| 13 | Ohio | 42,363 |
| 14 | Massachusetts | 37,740 |
| 15 | New Jersey | 33,290 |
| 16 | Maryland | 33,240 |
| 17 | Oklahoma | 32,127 |
| 18 | Minnesota | 28,615 |
| 19 | Wisconsin | 28,308 |
| 20 | Oregon | 27,514 |
| 21 | Alabama | 27,289 |
| 22 | Arizona | 26,878 |
| 23 | Indiana | 26,278 |
| 24 | Tennessee | 26,041 |
| 25 | Missouri | 25,917 |
| 26 | South Carolina | 24,950 |
| 27 | Mississippi | 24,348 |
| 28 | Louisiana | 23,853 |
The “Insured Unemployment Rate” per state
The “insured unemployment rate” across the US for the week ended May 16, also released today, declined to 13.1% (not seasonally adjusted), from 15.6% in the prior week. This is still far above the record in the pre-Covid-19 era of 7.9% (not seasonally adjusted) in May 1975. But the fact that it declined – this will have to be confirmed because this week-to-week number is volatile and might jump next week – may be another sign that the bottom is coming into view.
The “insured unemployment rate” for each state lags one week behind the national average. And they’re very different from the Bureau of Labor Statistics’ monthly unemployment rates for each state, which are based on household surveys. These rates here are based on unemployment insurance claims, on a weekly basis. And given the hurly-burly nature of the huge surge in unemployment claims in past weeks and the chaos that came with them, these rates have moved sharply from week to week, in either direction. So enjoy with some circumspection.
There are 37 states plus Washington DC with a double-digit “insured unemployment rate”; in six states, the rate is above 20%, with Florida at 25%, Nevada at 26.7%, and Washington at 31% (as I said, these rates move sharply in either direction, given the nature of tracking the chaotic collapse in the labor market on a week-by-week basis).
| Insured Unemployment Rate by state, week ended May 9 | ||
| 1 | Washington | 31.2% |
| 2 | Nevada | 26.7% |
| 3 | Florida | 25.0% |
| 4 | Hawaii | 23.4% |
| 5 | Michigan | 23.1% |
| 6 | California | 20.6% |
| 7 | New York | 19.9% |
| 8 | Rhode Island | 18.8% |
| 9 | Vermont | 18.2% |
| 10 | Connecticut | 18.0% |
| 11 | Georgia | 18.0% |
| 12 | New Hampshire | 17.6% |
| 13 | Pennsylvania | 17.4% |
| 14 | Louisiana | 17.3% |
| 15 | Mississippi | 17.1% |
| 16 | Massachusetts | 16.5% |
| 17 | Alaska | 16.2% |
| 18 | Maine | 15.3% |
| 19 | Oregon | 15.2% |
| 20 | Minnesota | 14.9% |
| 21 | New Jersey | 14.9% |
| 22 | West Virginia | 14.8% |
| 23 | North Carolina | 13.8% |
| 24 | Ohio | 13.2% |
| 25 | Kentucky | 13.0% |
| 26 | New Mexico | 12.9% |
| 27 | Illinois | 12.4% |
| 28 | South Carolina | 12.3% |
| 29 | Iowa | 12.1% |
| 30 | District of Columbia | 11.9% |
| 31 | Montana | 11.8% |
| 32 | Delaware | 11.4% |
| 33 | Virginia | 10.8% |
| 34 | Wisconsin | 10.8% |
| 35 | Alabama | 10.6% |
| 36 | Texas | 10.6% |
| 37 | Arkansas | 10.2% |
| 38 | Tennessee | 10.1% |
| 39 | Maryland | 9.9% |
| 40 | Missouri | 9.4% |
| 41 | Colorado | 9.2% |
| 42 | Indiana | 8.9% |
| 43 | Oklahoma | 8.6% |
| 44 | Idaho | 8.2% |
| 45 | Arizona | 8.0% |
| 46 | Kansas | 8.0% |
| 47 | North Dakota | 7.8% |
| 48 | Nebraska | 6.5% |
| 49 | Wyoming | 6.4% |
| 50 | South Dakota | 6.0% |
| 51 | Utah | 5.9% |
Holy cow, Los Angeles. The California economy is gradually opening up. But the exodus has started hard and heavy. And the influx has stopped. Read… Catastrophic Plunge in Jobs & Labor Force in Los Angeles, San Francisco/Silicon Valley Smacks into Housing Bubbles