by Dana Lyons

Formerly lagging equal-weight indices are attempting a comeback — a development which would bolster the odds of a significant rally.
This past summer, we began detecting signs of a thinning out of the U.S. equity rally, a trend which would eventually contribute to the recent market correction. One manifestation of that internal weakening was seen in the various “equal-weight” indices that we track, as noted in a late July post.
As the name implies, the equal-weight average weighs each of an index’s components the same, in contrast to popular cap-weighted indices which place more weight on larger stocks. Cap-weighted averages can give one a distorted view of the health of the broad market at times if they are being unduly influenced by a relatively small number of stocks. On the other hand, an equally-weighted index can give us a better sense of the level of participation across the entire index.
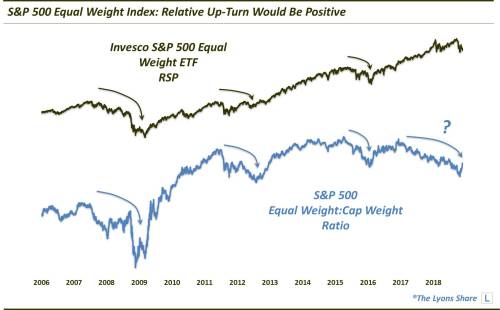
The benefits of widespread participation (and vice versa) can be seen in a ratio of an equal-weight index to its cap-weighted counterpart. For example, see this chart of the performance of the Invesco S&P 500 Equal Weight ETF (ticker, RSP) vs. its cap-weighted counterpart, the S&P 500 SPDR ETF (SPY). As you can see, when the ratio was heading higher (i.e., the equal weight RSP was out-performing), stocks trended higher. However, when the RSP has declined on a relative basis, we have tended to see the stock market suffer — as it has over the past several months.
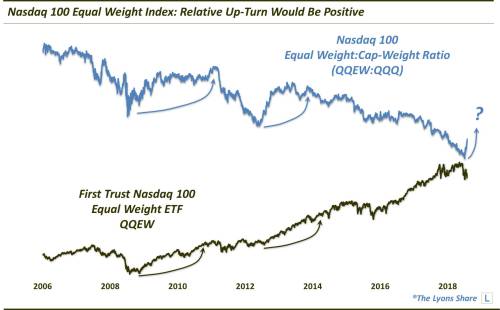
We can see the same general tendency in the ratio between the First Trust Equal Weight Nasdaq 100 ETF (QQEW) and the cap-weighted Invesco Nasdaq 100 ETF (QQQ). Though, given the overall dominance of the QQQ over the last dozen years, it is easier to see the benefits of the QQEW when the ratio is rising, e.g., coming off of the 2009 low and during the 2013 surge.
Unfortunately, as we mentioned, the equal-weight indices have struggled on a relative basis for most of the year, foreshadowing the recent rough patch in the market. However, they are presently attempting to stage some positive progress toward erasing at least the most recent deterioration suffered over the past several months. To wit…
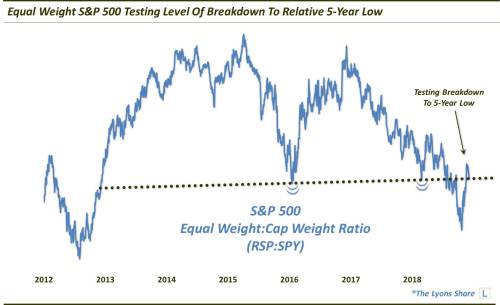
In the July post, we mentioned that the RSP:SPY ratio was breaking down to new 5-year lows, below the former lows from 2016 and early 2018. That opened the way to a more accelerated decline in the ratio — and the swift recent selloff in the market as as whole.
At present, however, the RSP:SPY ratio is attempting to reclaim that breakdown area, a development which would likely be a sign of improving internals — and perhaps a tailwind for the market.
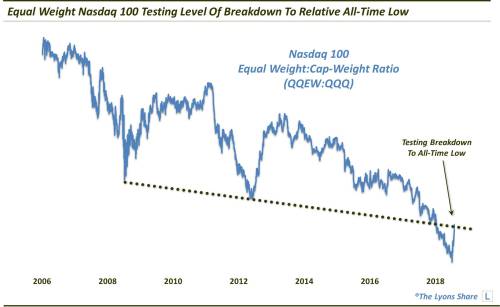
We are seeing a similar development in the QQEW:QQQ ratio. In this case, back in May, the ratio dropped below a trendline connecting (and supporting) a series of lower lows in the ratio going back to 2008. This too led to a swifter decline in the ratio, contributing to the recent sharp declines in the Nasdaq and technology sector.
However, as with the RSP, the QQEW:QQQ ratio has jumped in recent weeks and is challenging its former breakdown level.
Now, at times, these equal-weight ratios can see swift improvement during portions of a market correction when market participants begin to punish the largest caps to “catch up” to other stocks to the downside. However, in this case, the relative improvement in the equal-weight indices has occurred since the initial correction low in late October. That gives us some measure of optimism that this latest improvement in the broader market is legit.
The key, though, is what transpires at the breakdown levels of the respective ratios. Should they decisively reclaim the former breakdown levels, it should be a good sign for stocks in the short to intermediate-term. Should they fail here and resume their downtrends, it would be a sign that all is still not healthy in the broader market. We will continue to monitor these developments and provide updates in our AM Daily Strategy Sessions at The Lyons Share.