Wolf Richter wolfstreet.com, http://www.amazon.com/author/wolfrichter
They’re hot, price inflation is building up.
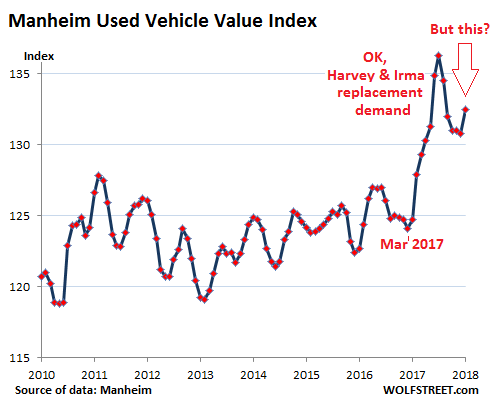
Wholesale used vehicle prices jumped 6.3% in April from a year ago, according to the Manheim Used Vehicle Value Index. At 132.5, the index is at the highest level since last November. The index had spiked as a result of replacement demand after Hurricanes Harvey and Irma. The price spike peaked in October, then reversed course. But in April, prices took off on their own, after the replacement demand had long been satisfied:
New-vehicle sales hog all the attention, for a good reason: They support a large part of the US economy – manufacturing, transportation by rail and truck, port operations, new-vehicle dealers, the finance and insurance business, the whole auto subprime industry, and so on. But with about 17 million vehicles sold a year, the new vehicle market is dwarfed by the used vehicle market.
About 40 million used vehicles will be sold in 2018. The 16,800 new-vehicle franchised dealers will likely sell about 15.5 million used vehicles, and the 23,000 or so independent dealers will likely sell over 25 million used vehicles.
The used-vehicle market forms the foundation of the new-vehicle market. Nothing works when the used-vehicle market gets gummed up. High used vehicle prices are essential for high trade-in values, and high trade-in values are essential for high new vehicle sales.
But the used-vehicle market is where rental cars and lease turn-ins end up. These usually recent-model and low-mileage vehicles compete with new vehicles, often on the same franchised dealer’s lot. Low wholesale prices make them very attractive to dealers, increase their used-vehicle margins, and cut into new vehicle sales as customers get switched from new to used. And so the used-vehicle market is a double-edged sword for the new-vehicle market.
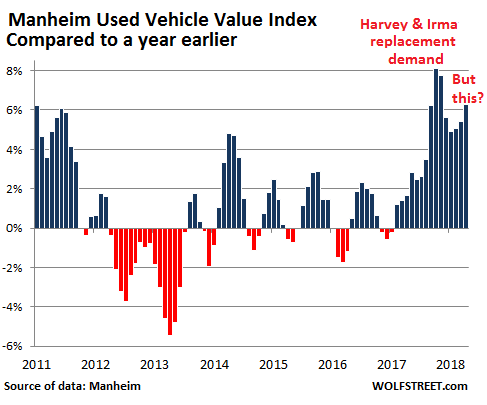
The chart below shows the changes of the Manheim Used Vehicle Value Index compared to a year earlier. Year-over-year price gains started timidly in February 2017, then surged, spiked to 8.1% in October under pressure from Harvey and Irma replacement demand, then backed off but remained high, and in April, the index rose to 6.3% year-over-year – and it wasn’t replacement demand:
Manheim, which runs millions of vehicles a year through its auction sites spread around the US, bases its index on the transaction prices at its auctions. The methodology – it adjusts for vehicle mix, mileage, and seasonal factors – makes this wholesale price index “independent of underlying shifts in the characteristics of vehicles being sold.”
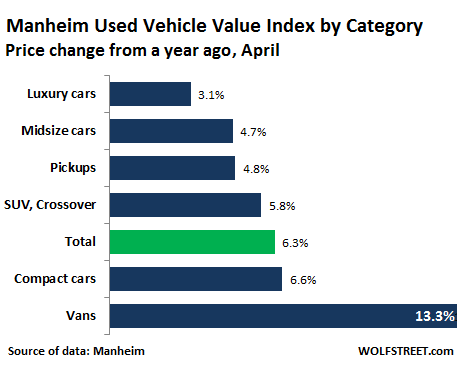
Manheim reported some interesting twists, on a year-over-year basis:
- Van prices soared by 13%!
- Prices of compact cars, a mainstay in the fleets of rental car companies, jumped 6.6%. They’re hot as used vehicles. But they’re duds in the new-car retail market; Ford, GM, and other automakers are cutting production and are scuttling entire model lines [Carmageddon for Cars: “Cars” Are Scheduled to Die]
- SUVs, compact SUVs (crossovers), and pickups – all of them white hot in the retail market – “underperformed” the overall wholesale market.
- “Collectively, non-luxury vehicles outperformed the market, while luxury vehicles underperformed. This is not unusual for the spring, as the observed bounce occurs only in non-luxury vehicles.”
The strength in the used-vehicle market was already building up in March, according to J.D. Power’s Spring Perspectives, which covers the broader used vehicle market:
The used vehicle market performed exceptionally well in March. Wholesale prices of used vehicles up to 8 years in age increased by an average of 2.5% (from February). While prices were expected to increase in March, the outcome was better than anticipated.
Mainstream car segments performed extremely well in March. Compact and Subcompact Car prices were the strongest in the industry and saw prices grow by 4.3% and 4.6% respectively. The pair’s result was about 2.5 points better than each segment’s previous 5-year average for the period.
The Mid-Size Car segment also experienced a healthy 3.5% increase in price, followed by the Large Car segment which saw a bump of 3%.
SUVs were the only “mainstream” segment with declining prices (-0.1%). “While miniscule, this does mark the third month in a row that Large Utility prices have slipped,” the report said.
This comes after a tough price environment in 2016 and early 2017 in the broader used-vehicle market as measured by J.D. Power. While volume was very strong, the supply from rental car companies and lease turn-ins was enormous, applying downward pressure on prices in the overall market. For 2017, the J.D. Power Used Vehicle Price Index for units up to eight years in age had fallen another 2.9%, ending the year 6.9% below the peak year of 2014.
Used vehicle prices contributed to the low-inflation scare early and mid-2017. But this phase seems to be over. Official consumer price inflation data takes a while to catch up with market movements on the wholesale side since units bought at auctions then need to be retailed, which might take a couple of months on average, before they even come to the attention of the data gatherers. But that’s already happening.