by UPFINA
One of the biggest questions in economics is determining when the economy will be able to survive on its own without fiscal stimulus. That’s important because getting legislation passed has been tough. If the GOP wins the Senate, it will stay tough because Congress will be divided. There is about a 50% chance the GOP wins this November. We don’t need to ask if the economy can survive without zero percent rates because we know the Fed is more than willing to oblige with that. We won’t find out if the economy can survive without stimulus in the July PCE report, since unemployment benefits were still given out in that month.
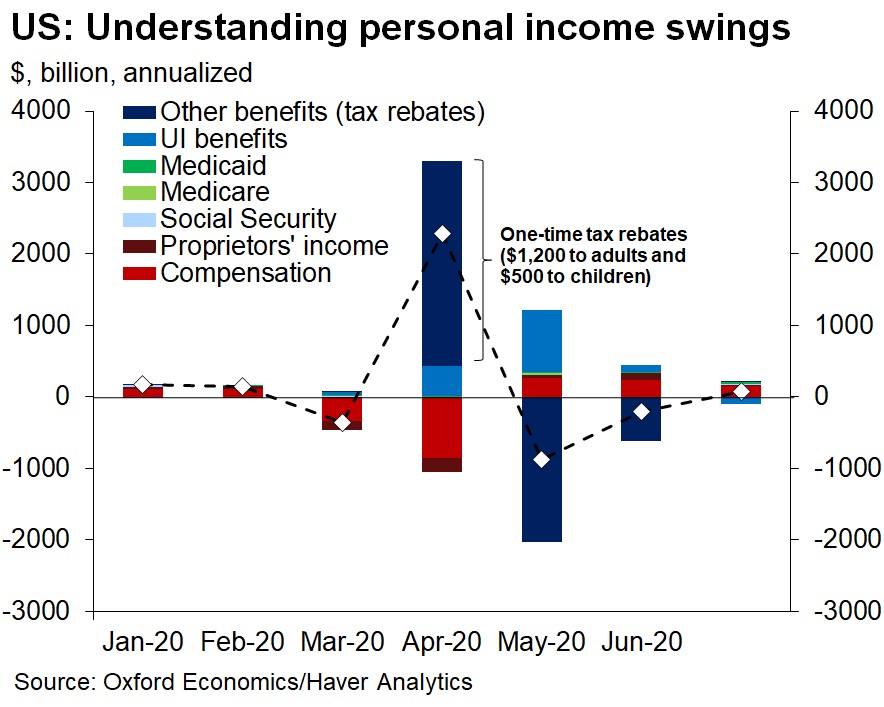
The unemployment insurance boost and the CARES act paid $9 billion more than people lost in wages; the money went disproportionately to poor people. It was probably one of the best recessionary fiscal policies ever. The chart below shows the impacts on personal income each month. Some of the handoff had already taken place in July from the government to the private sector as compensation drove income growth. Income rose $70 billion as a $150 billion increase in compensation was offset by a $105 billion decline in unemployment benefits.
Disposable Income Changes
Personal income was up 0.4% monthly which was up from -1% and beat estimates for -0.2%. Disposable income growth was 0.2%; its still above pre-COVID-19 levels. Real disposable income was down 0.1%. The chart below shows the decomposition of changes to disposable income from before the pandemic (February) to July. As you can see, income is $376 higher.
Unemployment insurance saved the day as it helped income by $873, while wages and salaries hurt income by $495. This is on a per household basis. Obviously, there are wide variations between those with a household where someone lost their job and households where no one lost their job.
Savings Rate Falls (It’s Still Very High)
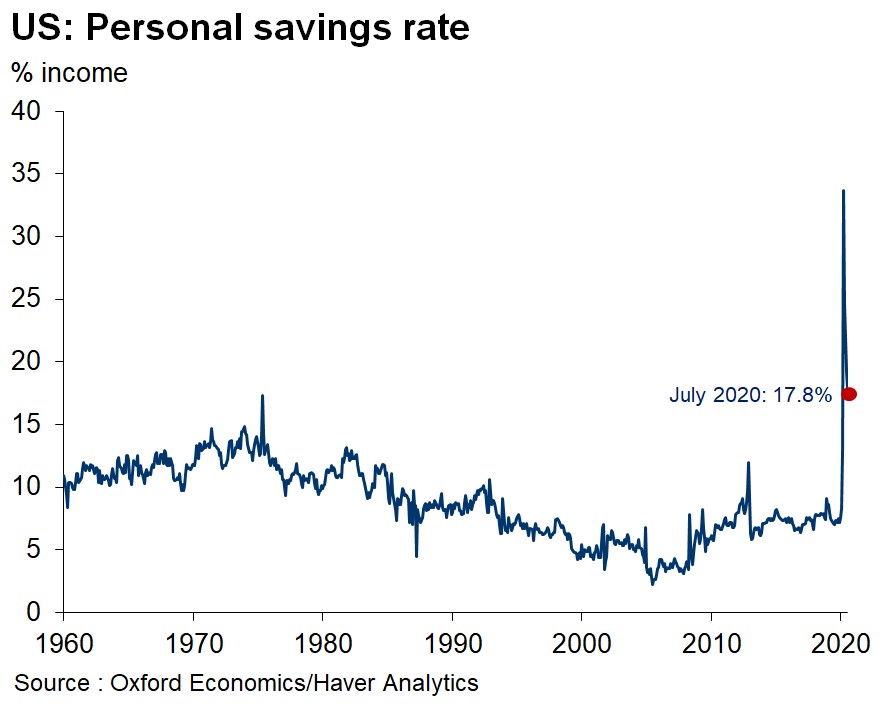
Besides the fact that the consumer can’t solely rely on the government forever and that Congress has a tough time agreeing to legislation, public sector support is bad because consumers are less likely to spend the money they are given because they assume it won’t last. This is why there wasn’t an immediate crash when the $600 in weekly unemployment benefits went away. People saved the money. As more people get their jobs back, the savings rate will fall. We want the savings rate to fall because consumers are more confident, not because their income is so low they can’t afford to save.
As you can see from the chart below, the savings rate fell 1.4% to 17.8% which is still historically high. It’s higher than any point prior to this year. The other aspect boosting savings is that people are still limited on what they can do because of COVID-19. Wealthy people are taking less vacations for example.
Changes To Spending
Consumer spending growth was 1.9% which beat estimates for 1.5% and fell from 6.2% (tough comp). Real spending was up 1.6%. The chart below shows the massive changes to how people spent their money since the before the pandemic (February).
Household spending has made a strong recovery from its April trough, but the nature of the rebound is unique to the Global Coronavirus Recession:
– spending on goods 7% higher than pre-#COVIDー19
– spending on services 10% lowerOverall, spending still only 95% of pre-Covid pic.twitter.com/Ng9BTFBcHz
— Gregory Daco (@GregDaco) August 28, 2020
Spending on goods is 7% higher, while spending on services is 10% lower. Overall spending is down 5% which contrasts with the higher income from before the pandemic. Consumers still have fire power. Some of that may have been used in August as benefits fell. Some of the categories that got hit the hardest rebounded sharply this summer. Clothing and footwear went from down 45% in April to down 1% in July.
Consumer Sentiment Stays Weak
Since we already got the August Conference Board consumer confidence reading, we knew the University of Michigan consumer sentiment index would be weak as well. You can see the two readings in the chart below. The sentiment index rose from 72.8 to 74.1 which beat the highest estimate which was 73. The bar had been lowered. Current conditions rose a tick to 82.9 and expectations rose from 65.9 to 68.5.
University of Michigan Consumer Sentiment index +1.6ppt to 74.1 in August:
– Current conditions +0.1pptto 82.9
– Expectations +2.6ppt to 68.5"Consumer sentiment has remained trendless in the same depressed range it has traveled during the past five months." Richard Curtin pic.twitter.com/JHQYbYhY46
— Gregory Daco (@GregDaco) August 28, 2020
9 in 10 consumers described the current economy negatively in August. The good news is half of consumers expected an improvement in the next year. 62% of consumers said the economy was best described as unfavorable.
Low Income Doing The Best?
As you can see from the chart below, consumer spending in the week of August 16th was 4.6% below where it was in January.
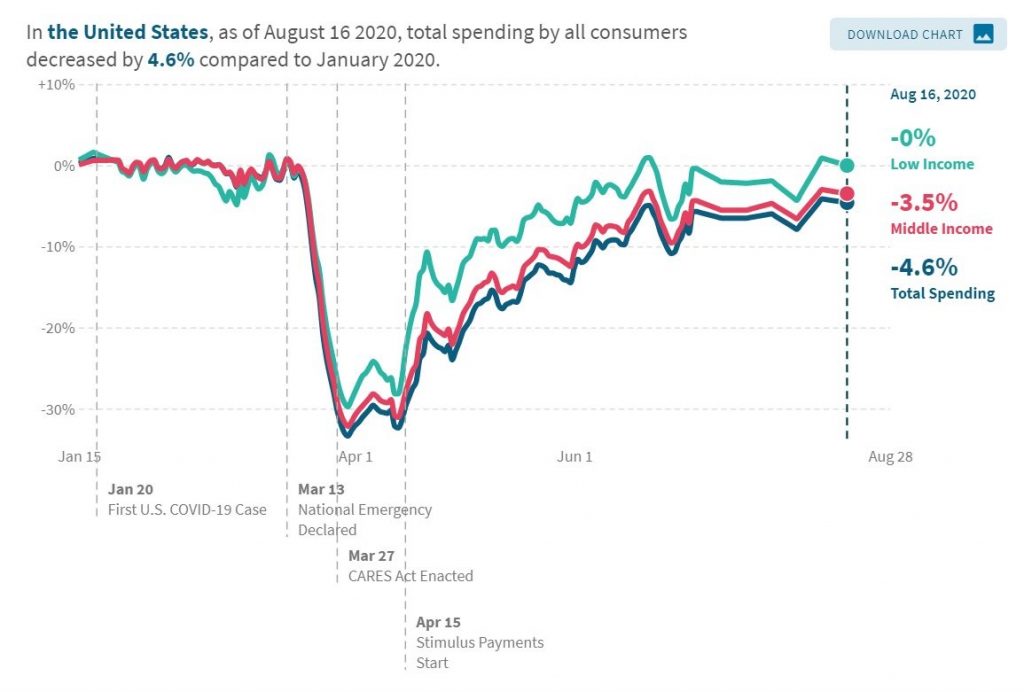
Low income spending is back to even. That doesn’t mean low income people are doing the best. They certainly were helped the most by fiscal stimulus. However, a greater percentage of their income is spent on necessities. That means they have less room to cut spending when they aren’t confident. This isn’t like rich people who pared back on discretionary travel expenses. Middle income spending was down 3.5% and upper income spending was down more than 4.6%.
Inflation Increases, But Stays Low
Headline PCE inflation was 1% which was up from 0.9%. Core PCE inflation rose from 1.1% to 1.3%. That’s just after the Fed said it wouldn’t mind if inflation got above 2%. That’s wishful thinking. We will probably only see above 2% core inflation next year when the deepest declines in 2020 are lapped.
As you can see from the chart below, Oxford Economics doesn’t see core PCE inflation staying sustainably above 2% in the near future.
Wild swings in #inflation over recent months, but the dislocations from the Global Coronavirus Recession have mostly been disinflationary.
Core PCE #inflation 1.3% y/y in July & not seen rising sustainably above 2% in near future. pic.twitter.com/5ti20BPgcB
— Gregory Daco (@GregDaco) August 28, 2020
In the past 5 years, core PCE inflation has been above 2% for 8 months. That means it was below the target 87% of the time. On a yearly basis, since 2007, the average core inflation rate has been at or above 2% once which was 2018. The Fed realizes inflation just getting to its 2% goal shouldn’t catalyze rate hikes because the average is still far below 2%. The Fed got too aggressive near the end of last cycle when inflation was temporarily at its target.
Conclusion
Even though in July people were still getting the $600 in weekly unemployment insurance, we saw the private sector start to take the hand-off from the government which is a good sign. Consumer spending in many of the hardest hit categories is starting to come back. Consumer sentiment is still weak, but consumers think the next year will be better. Low income spending is fully back. Core inflation increased to 1.3% which is still below the Fed’s goal. The Fed isn’t going to hike rates right away if inflation gets to its 2% target.