Wolf Richter wolfstreet.com, http://www.amazon.com/author/wolfrichter
I’m shedding a different light on consumer debt.
This type of chart is trotted out constantly these days to show that American households are in fabulous shape when it comes to their ability to service their blistering record debts. The red line in the chart shows household debt-service payments (combined monthly payments on mortgages, credit cards, auto loans, and student loans) as a percent of disposable (after-tax) income. Since 1980, the ratio has ranged from 9.9% to 13.2%. It hit that top in Q4 2007 just before it all came apart. Ten years later, it was at 10.3%. Hence the conclusion that households won’t have any trouble servicing their record debts. In a moment, we’ll get to the trap in this conclusion.
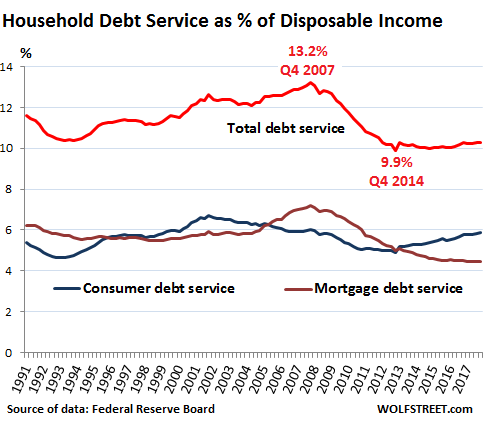
The chart above also shows separately the mortgage-debt-to-disposable-income ratio (brown line) and the non-housing consumer-debt-to-disposable-income ratio (blue line). Both combined make up the red line.
These debt-service ratios are a function mostly of three factors: The dollar amount of the debt; the interest rate on that debt; and the amount of disposable income. The logic is that rising disposable income supports rising indebtedness.
The large decline of the debt-service ratio from the peak of 13.2% in Q4 2007 to the all-time low in the data of 9.9% in Q4 2012 was caused by several factors:
- Consumers “deleveraged” mostly by shedding their debts via defaults and bankruptcies.
- Homeownership dropped to lows not seen since the 1960s. As households became renters, their mortgage debts were eliminated.
- Mortgage debt plunged by $1.2 trillion, or by 11.3%, from $10.6 trillion in 2007 to $9.4 trillion at the end of 2014. It has since risen to $10.1 trillion.
- Non-mortgage consumer debt dropped by $150 billion or 5% by late 2010, as student loans continued to surge while auto loans and credit card debt experienced sharper declines. It has since surged 47% past the prior peak.
- Interest rates also plunged. This allowed the remaining homeowners to refinance at a lower interest rate, and it allowed homebuyers to get lower-interest-rate mortgages. Interest rates on many consumer loans also dropped.
- Disposable income rose from $10.7 trillion at the end of 2007 to $14.6 trillion at the end of 2017 (not adjusted for inflation), largely due to an additional 9.2 million jobs and nominal wage gains.
It all looks good, in terms of the debt burden. And so the red line in the chart above is trotted out to show that the American consumer – this unified, amorphous, monolithic structure whose job it is to hold up the entire global economy – is strong and won’t buckle.
But there’s another way to look at this — and not as a monolithic structure. Many consumers are debt free and have lots of money and good jobs. Other consumers have large amounts of debt, lousy jobs or no jobs, and are paying for groceries by charging them on their credit cards. Credit problems always involve the most vulnerable consumers. During the mortgage crisis, the delinquency rate peaked at 11.5% in 2010. It wasn’t the 60% of homeowners that had significantly payed down their mortgages or owed no money on their homes who triggered that event. It was the financial mayhem among the smaller portion of the most exposed and most vulnerable.
For a different view of the burden of debt, let’s look at non-housing consumer debt, because this is where the music is playing right now. To eliminate for a moment the impact of interest rates, let’s look at the amount of debt – not the monthly payments – as percent of disposable income.
And suddenly, the risks emerge a little more clearly. At year-end 2017, the ratio of non-housing debt – revolving credit such as credit card balances, plus auto loans and student loans – to disposable income reached a new record of 26.3%, up from 23% at the end of 2010, and up from 24% in 2007, the peak before it all came apart during the Great Recession:
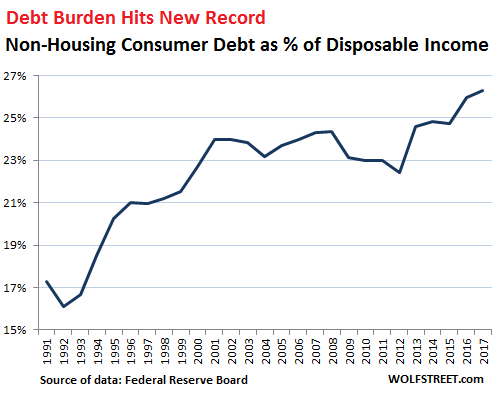
So the ratio of non-housing consumer debt to disposable income – the burden these consumers carry on the backs in relationship to their incomes – is higher than ever, and only historically low interest rates have kept it manageable.
But interest rates are now rising, and many of these consumer debts have variable rates.
This explains a phenomenon that is already appearing: How this toxic mix – rising interest rates and record high consumer debt in relationship to disposable income – has now started to bite the most vulnerable consumers once again. And for them, debt service is getting very difficult.
In Q1, the delinquency rate on credit card debt at banks other than the largest 100 – so at the 4,788 smaller banks – spiked to 5.9%, higher than at the peak during the Financial Crisis, and the credit-card charge-off rate spiked to 8%. These smaller banks marketed to the most vulnerable consumers that had been rejected by the biggest banks. And now, once again, subprime is calling. Read… Credit Card Delinquencies Spike Past Financial-Crisis Peak at the 4,788 Smaller US Banks