by UPFINA
The decline in the trade deficit in November is a huge deal. The deficit fell from $46.9 billion to $43.1 billion which was the narrowest deficit since October 2016. This was lower than estimates for $43.9 billion. However, estimates were only so low because the advanced trade in goods report told us about the goods deficit last week. That deficit was below the consensus considerably. Exports were up 0.7% monthly as they were boosted by capital goods, autos, and consumer goods. Imports were down 1% monthly as they fell for the 3rd straight time. They were driven lower by capital goods, consumer goods, and industrial supplies.
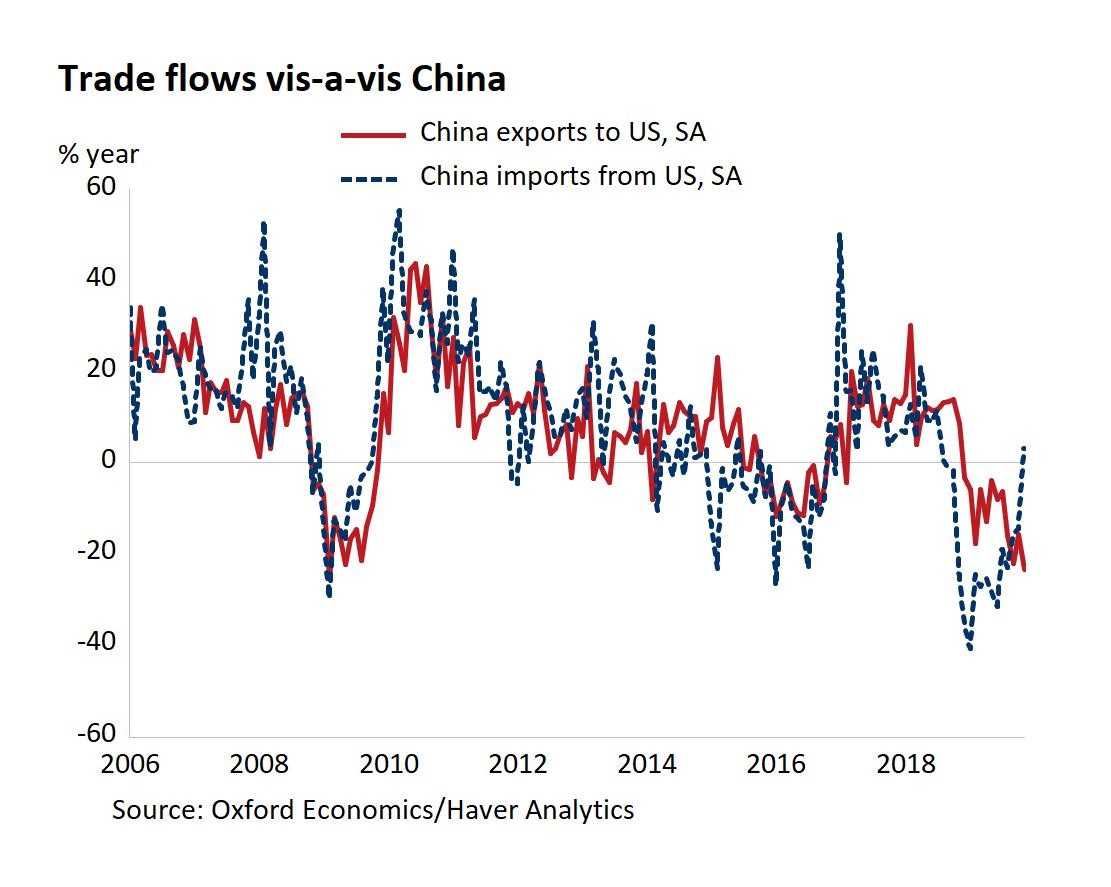
The trade deficit has continued to collapse mostly, but not entirely, due to China.
Read more in tonight's Closer: https://t.co/Hff2XtOEuf pic.twitter.com/1U4n5UE6IX— Bespoke (@bespokeinvest) January 7, 2020
The deficit shrunk partially because of the trade with China as China started to import more goods from America, but the US didn’t do the same as the chart below shows. Year to date the deficit with China is down $61.3 billion to $319.8 billion. This will likely be the first decline in the deficit with China since 2013.

Overall real exports were up 0.4% yearly and real imports were down 3.4%. America’s yearly trade deficit might decline for the first time in 6 years. We are seeing the impact of weak global growth, the trade war with China, the strong dollar, and policy uncertainty. Also, the deficit is shrinking because the US has gone from a big importer of petroleum products to an exporter. America’s petroleum surplus was $800 million in November which was the highest ever. Imports of crude oil fell to a 28 year low. Starting in September, America became a net exporter of petroleum products for the first time ever. As the trade war with China winds down, the US should increase imports from China. However, the exporting of petroleum is a secular trend as fracking expands.

This low trade deficit is a huge deal because of its impact on GDP growth. Oxford Economics estimates trade will boost Q4 GDP growth by 1.2% which means they see growth of 2.4%. Inventories are projected to hurt growth by 0.5%. Similarly, the Atlanta Fed Nowcast maintained its projection for 2.3% growth on January 7th. The decline in its estimates for real PCE growth and real private gross domestic product were canceled out by the trade data. The decline in motor vehicle sales from 17.1 million to 16.7 million in December isn’t good for retail sales.
Markit Services PMI Ticks Up
The Markit services PMI increased from 51.6 to 52.8 in December which means it now agrees with the ISM data that the service sector is outperforming manufacturing. That would be consistent with the prior 2 slowdowns as manufacturing is more cyclical. The improvement in services caused the composite PMI to increase from 52 to 52.7 despite the 0.2 decline in manufacturing.
New business increased for the 2nd straight month. Increased client demand led to the quickest new orders growth in 5 months. Foreign demand increased just like in the manufacturing report. Foreign new business was up for the first time since July. Employment was up for the 2nd straight month. Job growth was the best since July. Prior to this recent uptick, Markit employment data was much weaker than the BLS reports. Backlogs were unchanged.
Input costs were up for the 3rd straight month and input inflation was the highest since July. Supplier and wage costs boosted inflation. Output prices were up even more as output inflation was the highest since February. 1 year confidence was up sequentially. This PMI is consistent with 1.8% GDP growth. That’s 0.1% above Oxford Economics’ forecast excluding trade and inventory investment.
Solid ISM Services PMI
Unlike the manufacturing report, the services ISM PMI was relatively strong. The difference between the services and manufacturing PMI was the highest since October 2015. Specifically, the ISM services PMI was up from 53.9 to 55 which beat estimates for 54.5 and met the high end of the consensus range. It was below its 12 month average which was 55.5, but it was the best PMI since August.
Within the report, the business activity index was up 5.6 points to 57.2. Some criticized this report because this is a volatile component. 10 industries had growth in business activity and 7 had declines in business activity. The new orders index was down from 57.1 to 54.9 which was unlike the increase in the Markit report. 10 industries had improving new orders and 6 saw declines. Unlike the Markit report, the ISM prices index was unchanged as it stayed at 58.5. The new export orders index fell 1 point to 51. The ISM services PMI is consistent with 2.2% GDP growth which is 0.4% above the Markit estimate and 0.2% above the median consensus. The employment index was down 0.3 to 55.2. That’s not great because the service sector drives most job creation.
The charts below show the track record of the ISM and Markit services and manufacturing PMIs compared to yearly GDP growth. The services ISM PMI and the manufacturing Markit report are the most correlated with GDP growth.
Comparing ISM & PMI sentiment indices, who wins the horse race in correctly NOT forecasting a US 2019 recession? For manufacturing, the PMI (rhs) did better, suggesting a shallower downturn. On the services side, ISM is better, painting a more robust picture. Everyone's a winner! pic.twitter.com/u6T4ptPl1R
— Robin Brooks (@robin_j_brooks) January 7, 2020
Within the ISM services comments section, there was one mention of the trade war. A construction firm stated, “Weather and the holiday season have had an impact on residential new construction sales and production. While demand is outstripping supply in the housing market, business is down due to global trade insecurity causing affordability, labor and cost pressures.” This isn’t consistent with the very strong Housing Market index. A retail trade firm stated, “The shorter-than-normal holiday season tightens sales opportunities; however, initial trends have been favorable.” This looks good for the holiday shopping season.
Conclusion
Because of the global cyclical slowdown, the decline in imports from China, and petroleum exports, America’s trade deficit has been falling. This is a big deal for Q4 GDP growth as it could potentially drive half of growth. We will look at growth without trade and inventories to determine the underlying strength of the economy when the report comes out on January 30th. Both the Markit and ISM services PMIs increased as they are consistent with 1.8% and 2.4% GDP growth. The ISM services index has been more correlated with yearly GDP growth this cycle.