Why U.S. Household Wealth Is In A Bubble – Part 1
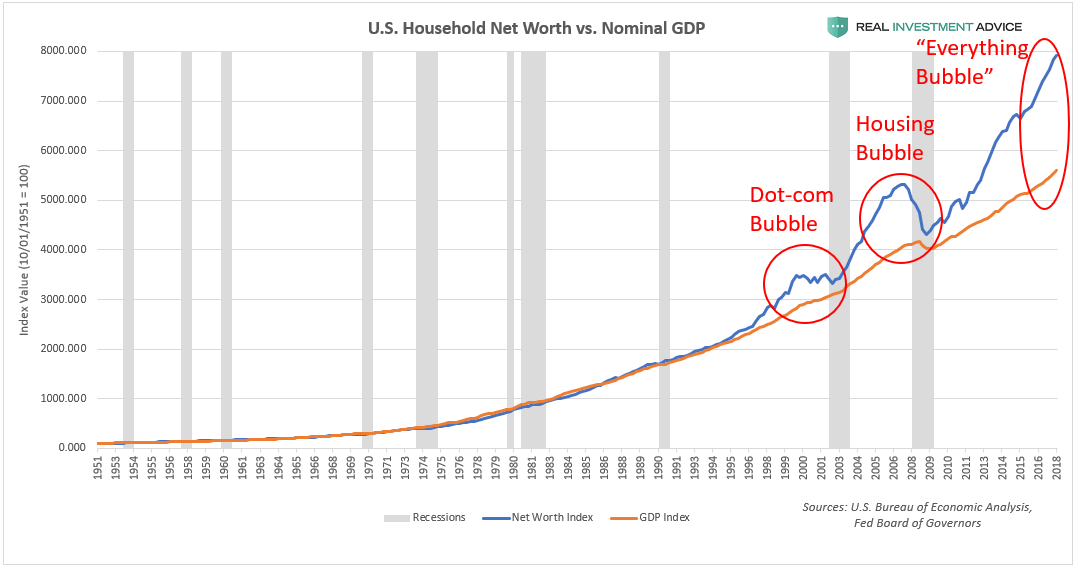
Since the financial crisis in early-2009, household wealth has surged by nearly $46 trillion or 83 percent to a record $100.8 trillion. As the chart below shows, the powerful increase in household wealth (blue line) has far exceeded the growth of the underlying economy, as measured by the GDP (orange line). Household wealth should closely track the economy, as it did during the 20th century until the extreme boom-bust era that started in the mid-to-late 1990s.
When household wealth tracks the growth of the economy, it’s a sign that the wealth increase is likely organic, healthy, and sustainable. When household wealth far outpaces the growth of the underlying economy, however, that is a tell-tale sign that the boom is artificial and unsustainable. The last two times household wealth growth exceeded GDP growth by a large degree was during the late-1990s dot-com bubble and the mid-2000s housing bubble, both of which ended in tears. The gap between household wealth and the economy is far larger today than it was in the last two bubbles, which means that the coming reversion or crash is going to be even more painful, unfortunately.
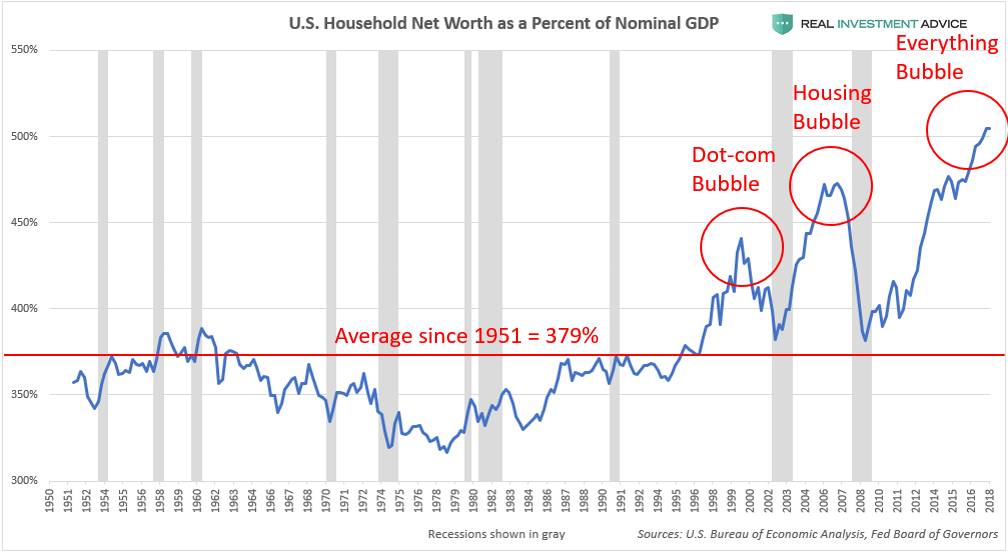
Another way of visualizing the household wealth bubble is to plot it as a percent of GDP, which paints the same picture as the chart above. U.S. household wealth is currently 505 percent of the GDP, which is even more extreme than the housing bubble’s peak at 473 percent, and the dot-com bubble’s peak at 429 percent. Household wealth has averaged 379 percent of the GDP since 1951, so the current 505 percent figure is completely out of line, which means that a violent reversion to the mean (aka, another crash) is inevitable. To make matters even worse, the 379 percent average figure is skewed upward by the anomalous boom-bust period that began in the mid-to-late 1990s. When U.S. household wealth comes crashing down again, there is a very good chance that it will overshoot below its historic average due to how stretched it has become during the current bubble.
What is driving the current U.S. household wealth bubble and why is it happening? The answer lies squarely with the U.S. Federal Reserve and its actions during and after the Global Financial Crisis. During the Crisis, household wealth plunged as stocks, housing prices, and bonds (aside from Treasuries) cratered. These aforementioned assets make up the bulk of household wealth, so bull markets in stocks, housing, and bonds lead to bull markets in household wealth and vice versa. When household wealth plunges as it did in 2008 and 2009, consumers pare back their spending dramatically, which leads to even more economic pain.
In an attempt to pull the economy and financial markets out of their deep-freeze, the Federal Reserve cut interest rates to record low levels and launched emergency monetary stimulus policies known as quantitative easing or QE. QE basically entails creating new money out of thin air (this is done digitally) and using the proceeds to buy mortgage-backed securities and Treasury bonds with the idea that the massive influx of liquidity into the financial system would indirectly find its way into riskier assets such as stocks. Even though the Fed only has two official mandates (maximizing employment and maintaining price stability), boosting asset prices essentially became their unspoken third mandate after the 2008 financial crisis.
As former Fed chairman Ben Bernanke wrote in a 2010 op-ed in which he explained (what he claimed to be) the virtues of the Fed’s new, unconventional monetary policies:
And higher stock prices will boost consumer wealth and help increase confidence, which can also spur spending. Increased spending will lead to higher incomes and profits that, in a virtuous circle, will further support economic expansion.
While the idea of having a central bank like the Federal Reserve boost asset prices to create an economic recovery may seem clever and admirable, it is terribly misguided because asset booms driven by central bank intervention are overwhelmingly likely to be unsustainable bubbles rather than genuine booms. Central bank-driven booms are very similar to sugar highs or highs from hard drugs – a crash is inevitable once the substance wears off. When central banks interfere in markets, they create mass distortions and false signals that trick investors into believing that the boom is legitimate, even though it’s not.
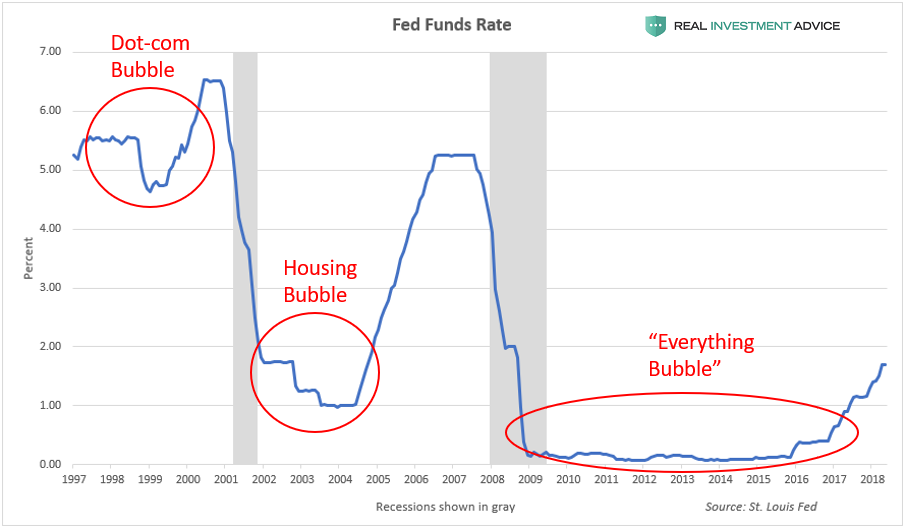
The chart below shows the Fed Funds Rate, which is the interest rate that the Fed raises and lowers in order to steer the economy. When the Fed holds rates at very low levels (which keeps borrowing costs in the economy low), dangerous bubbles form in asset prices and the overall economy. When the Fed ultimately raises rates, the bubble pops, which results in stock bear markets and recessions. The dot-com and housing bubbles formed during periods of low interest rates and popped when interest rates were raised.
What is terrifying is the fact that interest rates have remained at record low levels for a record length of time since the financial crisis, which means that the current market distortion and coming crisis will be even more extreme than the last two. Remember how extreme the current household wealth bubble looked in the two charts shown earlier in this piece? Well, that is certainly no coincidence: it is a direct result of the extremely loose monetary conditions over the last decade.
UNDERSTAND #INTERESTRATES UNDERSTAND THE INCOHERENCE
YOU ARE HERE ⬇

https://twitter.com/OccupyWisdom/status/1013729863381999616
