Entire market of 3,451 stocks minus “Giant 5” is down 1% from Jan 2018. But wow, the volatility! You would have been better off with a despicable freaking savings account.
By Wolf Richter for WOLF STREET.
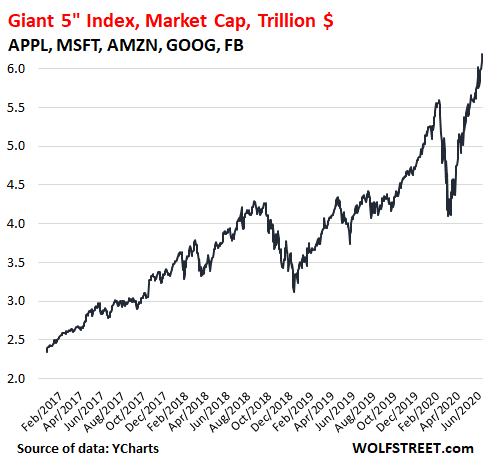
The market capitalization of the five largest stocks combined – the “Giant 5:” Apple, Microsoft, Amazon, Alphabet, and Facebook – rose to a new record today of $6.18 trillion. Since their combined low point on March 16, their market capitalization has soared by 51%. That’s an increase of $2.1 trillion in a little over three months. Since January 2017, my Giant 5 index has soared by 164% (market cap data via YCharts):

So how big did they get?
The overall stock market capitalization, as measured by the Wilshire 5000 Market Cap Index tracking 3,451 US-listed companies, ticked up to $31.8 trillion, up by 41.6% from its low on March 23.
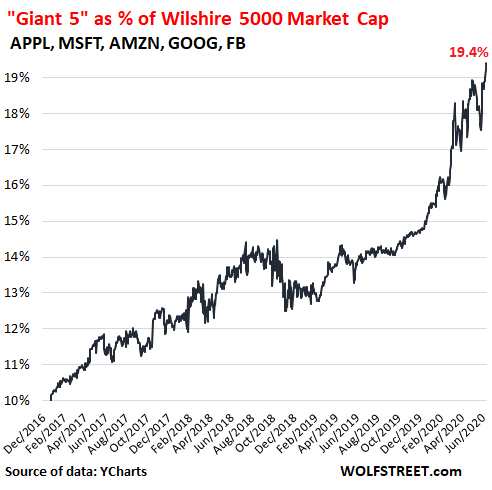
Today, the “Giant 5” accounted for 19.4% of the total US stock market capitalization, as measured by the Wilshire 5000, a new record. On January 3, 2017, the Giant 5 had accounted for 10% of the Wilshire 5000. In the three months since the crash in March, the share of the Giant 5 has soared from abound 16% to 19.4% today (Wilshire 5000 data via YCharts):
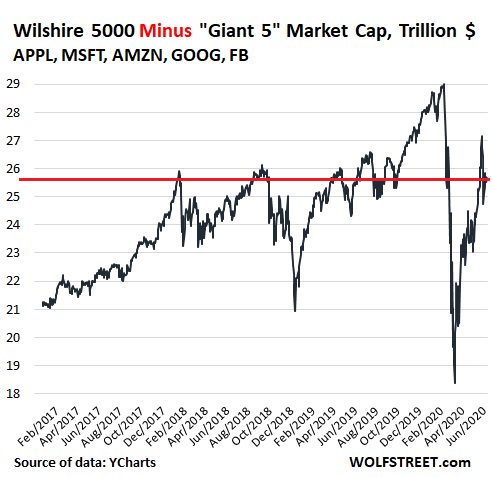
But wait… Performance of Wilshire 5000 without “Giant 5.”
Let’s take the five largest stocks out of the largest stock market in the world, with 3,451 companies, and see what’s left over. What’s left over is now valued at $25.7 trillion. It’s up by 28.4% from the March 23 low, and while that’s till strong for a three-month rally, it’s a far cry from the 51% for the Giant 5.
And here is the thing: All these companies combined, minus the “Giant 5,” are way below their peak in February 2020, and below a whole bunch of other dates before then, and below where they’d first been in at the end of January 2018.
For the entire rest of the stock market – all its winners and losers combined – minus the “Giant 5” the period since January 2018 was a very rough and unpleasant ride to nowhere. It declined 1%. You would have been better off putting your money in one of those despicable freaking savings accounts:
Seen the other way around: If you had shorted on January 26, 2018, the entire stock market minus the “Giant 5,” you would have had a wild unpleasant ride and made 1%. But if you had shorted the “Giant 5” over the same period, you would have lost 70%.
This is how dependent the stock market, and broad portfolios reflecting it, have become on the Giant 5. It’s not that there aren’t a bunch of other companies that have gained as much or more than the Big 5 in percentage terms – there are – but in dollar terms, and in weight in the market, they just don’t measure up to these five giants.
Apple and Microsoft both are now worth over $1.5 trillion. Amazon is at nearly $1.4 trillion, Alphabet at $1.0 trillion. These are gigantic valuations. They also speak of an immense concentration of power in a single company.
Among the losers in that rest of the market are companies that used to be the largest in the US stock market, such as Exxon-Mobile, which since January 26, 2018, has lost 48% of its value. The entire and once vast oil-and-gas sector has gotten crushed.
The market, and broad portfolios, are immensely dependent on the Giant 5. That was great on the way up – on their way to becoming giants, when their share of the overall market doubled in three-and-a-half years, from 10% in January 2017 to nearly 20% today.
But if they sell off – there are myriad reasons why giants sell off, as all prior giants have found out – the impact of these five companies is going to be proportional to their giant size.