via upfina:
The yield curve has become a hot topic again in the financial press because the most widely followed 10-2 spread finally inverted. There is too much analysis that just reviews what happens on average each cycle and not enough research into what is likely to happen based on the unique factors in this expansion. Even if data goes back a few decades, if there are only a few cycles to look at, that’s not a large sample size. We all know that the 10-2 curve has a good track record of predicting recessions, that stocks usually rally in the period after the inversion and before the recession, and that it takes about 21 months on average for there to be a recession after the inversion (assuming the indicator is correct).
Why The Yield Curve May Not Matter
It’s common sense that if everyone is looking at an indicator, it will lose the ability to generate alpha. That’s how events get priced in before they occur. It might even lose predictive value. On the other hand, let’s not forget that if everyone fears a negative catalyst, even if the indicator doesn’t lead to trouble, the fear of a negative impact itself can hurt the economy and markets.
https://twitter.com/teasri/status/1161631771525558273
The chart above shows an explanation as to why the yield curve won’t predict a recession in this cycle. It compares the net increase in household liabilities (lagged 1 year) as a percentage of GDP with the 10 year 3 month spread (the yield curve). The difference between this cycle and every other cycle is US households haven’t catalyzed domestic or global growth. Therefore, the yield curve may not matter. Some say that the next recession won’t be bad because US households have deleveraged this cycle. Others say, that’s not the reason why the next recession will be shallow; it’s the reason why there won’t be a recession soon. Recessions are about leverage and if you don’t have leverage, the yield curve isn’t important.
Debt As A Percentage Of GDP
That’s a perfect segue into an updated discussion on the latest NY Fed Household Debt and Credit report. The Q2 report showed total household debt increased from $13.67 trillion to $13.87 trillion which is a new record high. The record was driven by the new high in non-housing debt which increased from $4.02 trillion to $4.06 trillion. Housing debt increased from $9.65 trillion to $9.81 trillion. That’s still below the Q3 2008 record of $9.99 trillion. That’s a big decline in leverage in real terms and as a percentage of GDP.
The burst of the housing bubble catalyzed a deleveraging period which has allowed this expansion to last over 10 years. The bottom chart below shows the total consumer debt balance as a percentage of nominal GDP broken down by age.
Thought this was interesting… the consumer has not levered up relative to economic output pic.twitter.com/CGTN2TeUkI
— Jake (@EconomPic) August 13, 2019
Only older Americans have higher leverage than last cycle. That increased debt has simultaneously occurred with a huge increase in the percentage of older people working, making it less of an issue. During the last recession, 65 and older workers made up about 4% of the labor market; now it’s 6.4%.
Delinquency Rates
In the non-housing debt category this cycle, debt growth has been driven by student loans and auto loans. However, in Q2 student loan debt fell from $1.49 trillion to $1.48 trillion. On a rounded basis, that’s the first decline since at least 2004. In 2004, student loan debt was a mere $260 billion. That’s not to say, there will be a new downtrend in student loan debt. It’s simply that student loan debt growth is slowing. This shouldn’t be a surprise as debt growth in the double digits like it was earlier in the cycle would have caused student loan debt to encompass the entire economy quickly.
Auto debt increased from $1.28 trillion to $1.3 trillion and credit card debt increased from $850 billion to $870 billion. The chart below shows the 90+ day delinquency rates of each loan type.
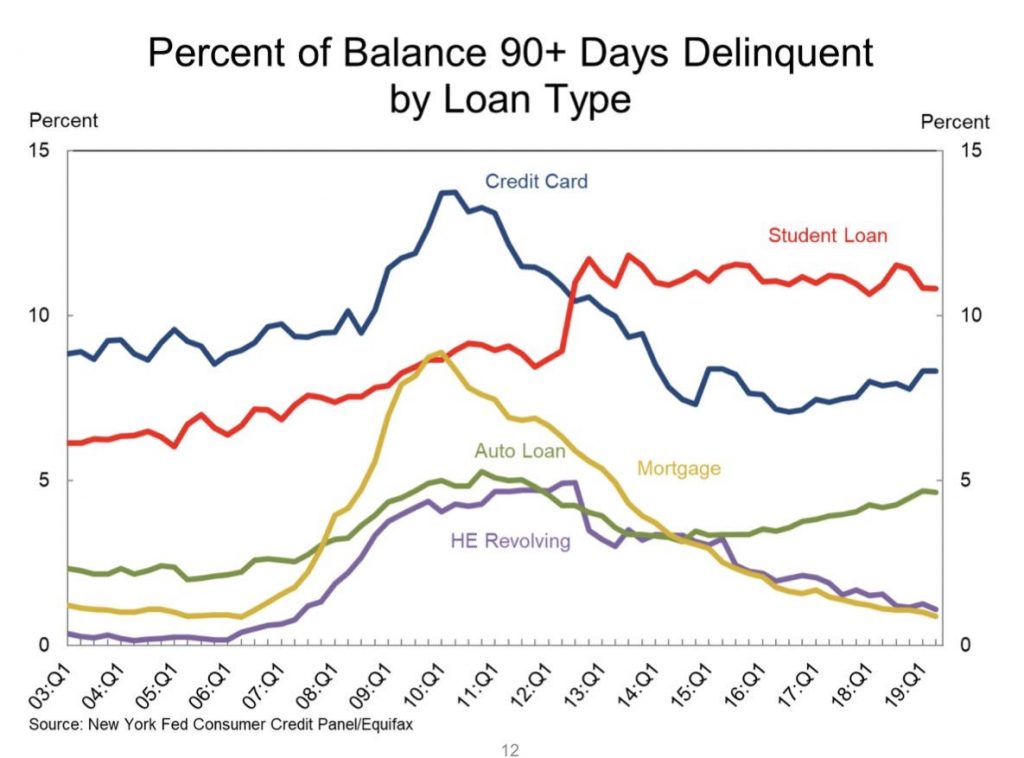
Student loan delinquencies fell from 10.9% to 10.8%. That’s still elevated. Credit card delinquencies stayed at 8.3%. That’s above the cycle trough of 7.1%. Auto loan delinquencies fell from 4.7% to 4.6%. That’s a helpful decline because the rate is near the previous post-recessionary peak of 5.3%. Finally, housing delinquencies fell from 1% to 0.9% which is the lowest rate since Q2 2006.
Housing Affordability Has Increased
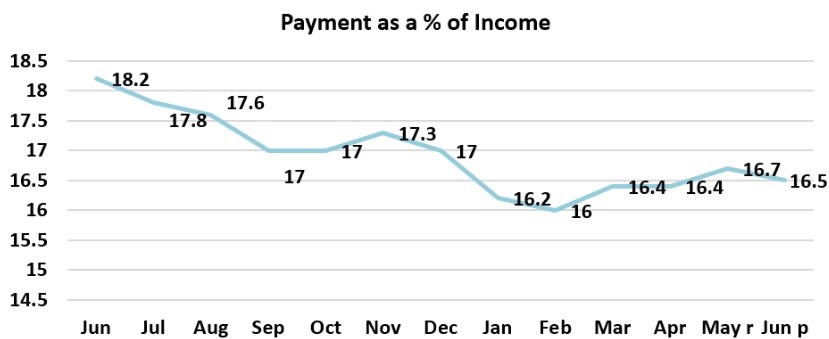
The decline in housing price growth and interest rates are making housing more affordable. Positive real wage growth and the low unemployment rate also help. With the 30 year treasury yield hitting a record low, the average 30 year fixed mortgage rate is likely to head lower. It’s at 3.6% now which is a 3 year low. In June 2019 housing affordability increased 10.3% nationally as compared to June 2018. The West and the South had the biggest gains which were 12% and 11%. The median sales price of new single family homes was up 4.5% to $288,900. Median family incomes were up 3.5% and interest rates fell 93 basis points. Just wait until the data from August comes out as rates have fallen since then. As you can see from the chart below, housing payments as a percentage of income have fallen from 18.2% to 16.5%.
Is Housing More Expensive Than Prior Decades?
When you adjust for mortgage rates, real housing payments have been steady in the past 50 years. The difference between the blue and orange lines below shows the effect of the decline in rates.
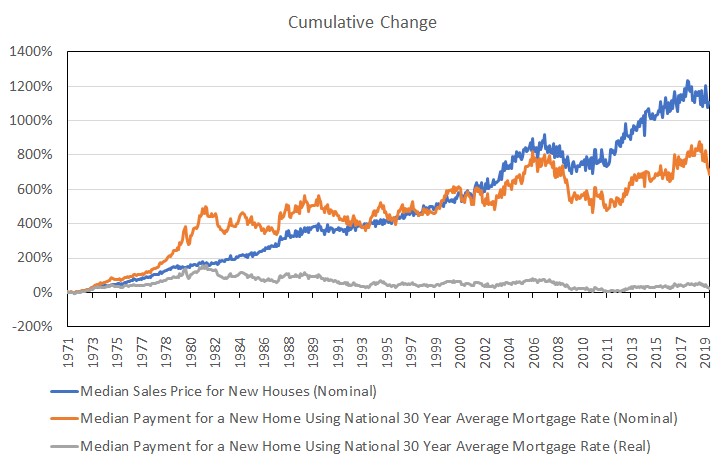
The grey line adjusts payment growth for inflation. In October 1981, a real mortgage payment would be $2,958 based on 18.45% rates for a house priced at $69,600 which is the median new home price for that period. The monthly mortgage payment for a present day new $310,000 house is just $1,406 based on interest rates of 3.5%. Housing has gotten more expensive in real terms, but the decline in interest rates has saved the day. These results don’t adjust for changes to taxes.
Conclusion
Everyone knows that yield curve inversions happen slightly less than 2 years before recessions on average. However, the lack of consumer leverage taken out this cycle might mean a recession isn’t coming. Consumer debt to GDP has fallen this cycle. Watch out for the recent upticks in credit card and auto loan delinquencies. Housing has recently gotten more affordable because of the decline in interest rates. In the past 50 years, real mortgage payments have been remarkably stable.