A Massive Looming Economic Slowdown?
Stanphyl Capital commentary for the month of July 2019, discussing a sign of a massive looming economic slowdown.
Friends and Fellow Investors:
For July 2019 the fund was down approximately 4.8% net of all fees and expenses. By way of comparison, the S&P 500 was up approximately 1.4% while the Russell 2000 was up approximately 0.6%. Year-to-date 2019 the fund is up approximately 11.8% while the S&P 500 is up approximately 20.2% and the Russell 2000 is up approximately 17.7%. Since inception on June 1, 2011 the fund is up approximately 83.9% net while the S&P 500 is up approximately 162.9% and the Russell 2000 is up approximately 107.9%. Since inception the fund has compounded at approximately 7.8% net annually vs 12.6% for the S&P 500 and 9.4% for the Russell 2000. (The S&P and Russell performances are based on their “Total Returns” indices which include reinvested dividends.) As always, investors will receive the fund’s exact performance figures from its outside administrator within a week or two and please note that individual partners’ returns will vary in accordance with their high-water marks.
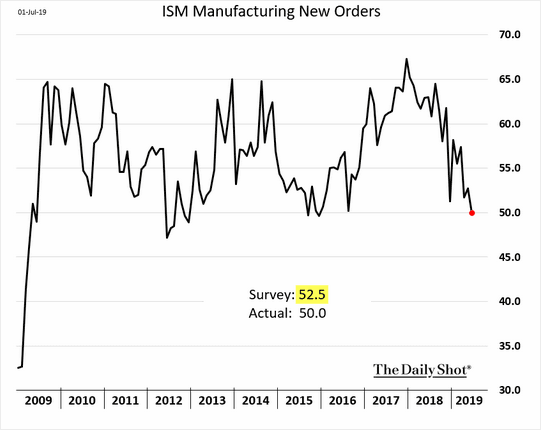
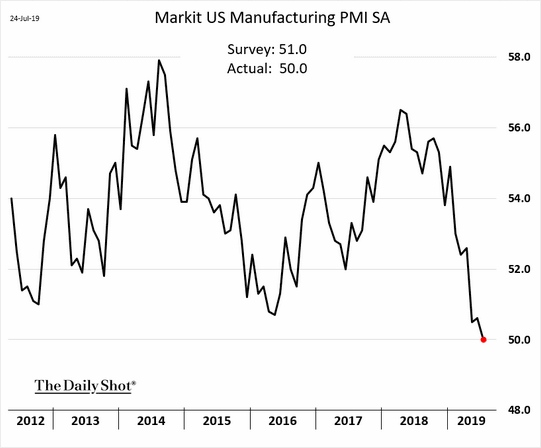
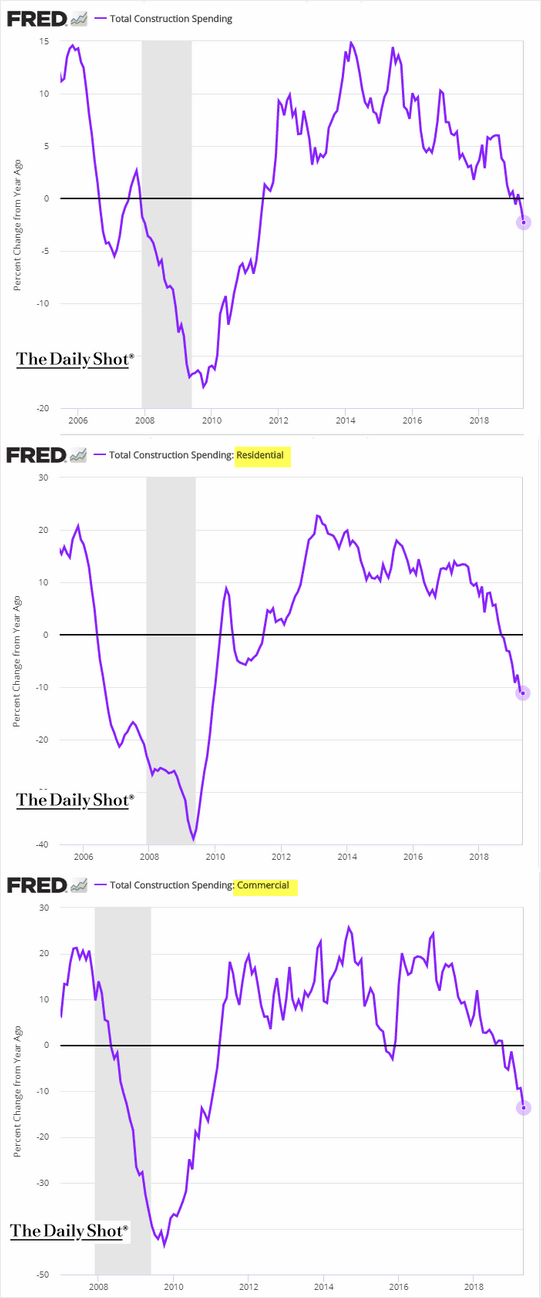
The fund remains very net short, as I continue to believe we’re about to enter a bear market for U.S. stocks as the U.S. economic slowdown worsens. Here are some charts explaining why:
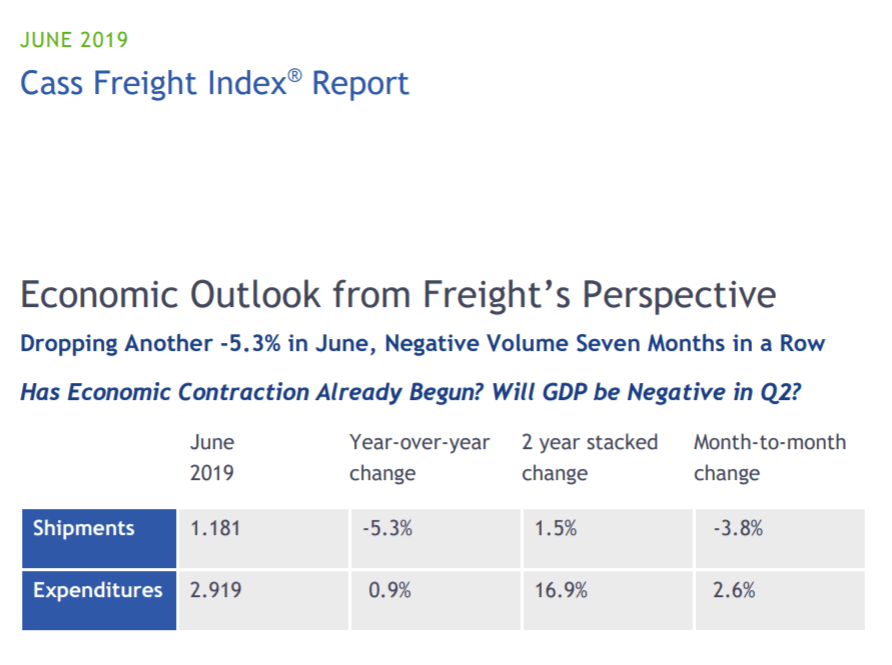
…while global negative yielding debt (a sign of a massive looming economic slowdown) has broached the insane level of nearly $14 trillion:

And have a look at how ugly U.S. rail traffic is and the horrible Chicago PMI out today.
Quants Warn Of “Lehman-Like” Market Crash Conditions In September
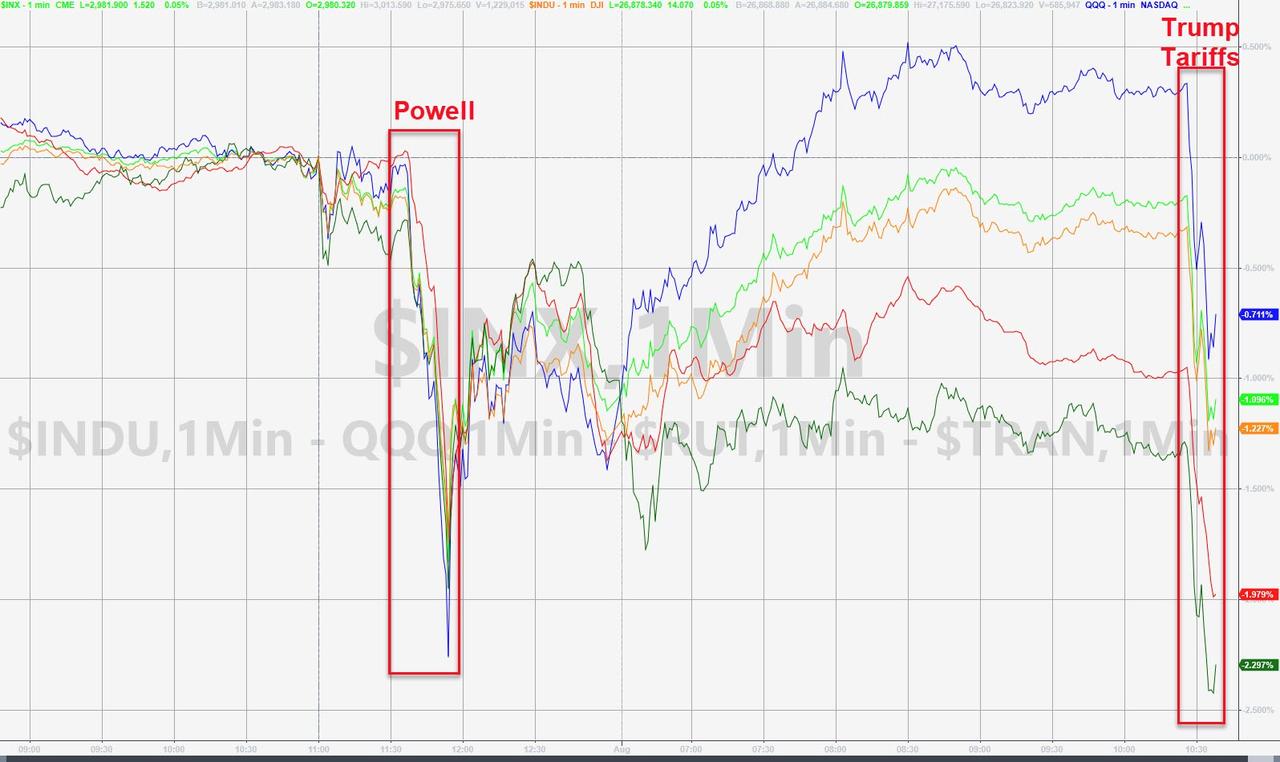
If there is anything today’s violent reversal in the market demonstrated, where this morning’s inexplicable levitation (well, maybe explicable now that “terrible news is great news” again) was smashed with stocks plummeting once Trump tweeted that the China trade war ceasefire is dead, and the US would impose “a small additional Tariff of 10% on the remaining 300 Billion Dollars of goods and products coming from China into our Country”, it is that algos, quants, and systematic funds remain the marginal price setters of the US stock market.
Indeed, as Bloomberg’s Andrew Cinko said when commenting on today’s early morning levitation, it “looks more like it’s being driven by ETF flows or perhaps quant- or multi-strategy firms. That’s money that tends to go out as quickly as it came in, leaving the S&P vulnerable to a reversal as the bid dissipates.” Ironically, just minutes later we got definitive proof of just how fast the passive, or algo money, flees in the milliseconds following Trump’s tweet.
So with the question of who did all the buying and subsequent selling today laid to rest, it makes further sense to ask what happens next, now that the ETFs, quants and generally math PhDs are in charge.
Well, according to Nomura’s quant insight team led by Masanari Takada, the answer is nothing good.
As Takada writes in his FOMC post-mortem analysis, in his baseline scenario, he expects selling of equities by CTAs and other such market participants “to not go beyond the clearing out of long positions; we would not expect these investors to start staking out new short positions unless the US economy were to suffer an obvious loss of momentum.” Which is precisely what Trump’s restart of the US-China trade war virtually assures.
Looking over the positioning of various speculative traders, Nomura says that it appears that the selling of US equities has been led by trend-following algos (CTAs, risk-parity funds). For the moment, then, the selling thus appears to be mostly technically driven.
As the Nomura quant notes, “trend-following CTAs seem to be prioritizing exits from long positions in US equity futures. Having recently built up sizable net long positions in both S&P 500 futures and NASDAQ 100 futures, CTAs are now paring those positions in response to uptick in volatility and shift in market tone that followed the FOMC meeting.”
However, the selling by CTAs is as of yet just a matter of profit-taking. According to Takada, the average break-even line for CTAs’ net long position in S&P 500 futures is at around 2,960, below which the selling will accelerate in linear fashion. Which is precisely where the S&P is trading as of this moment.
Equities pricing in a Global PMI of 53 by year end. t.co/TiPlohOUMx
— Teddy Vallee (@TeddyVallee) August 1, 2019
party like it's 1998? pic.twitter.com/Juf47Sw2ot
— Alastair Williamson (@StockBoardAsset) August 1, 2019