by C Hamilton
Summary
Nations with 56% of world GDP have declining annual births and childbearing populations, nations with 35% of GDP have declining births but still rising/flat childbearing populations, nations with less than 9% of world GDP have rising births and childbearing populations.
Detailed below are 1950 through 2040 annual births, female childbearing, and female post-childbearing populations of worlds largest economies.
Utilizing UN World Population Prospects 2019 data.
In the wake of the great financial crisis of 2009, ZIRP/NIRP were utilized, federal deficit spending soared, asset prices skyrocketed, employment rose to record levels…but strangely fertility rates and total births have continued falling. Actually, collapsing. Record wealth has been accompanied by record low birth rates and unwillingness to have children, suggesting that those reaping the gains of the asset-price-pallooza are not of childbearing age. The policies since 2009 have rewarded asset holders for being asset holders and penalized young, poor, and those without assets…for being without assets.
Simply put, costs of living and assets have risen far faster than incomes. Rent, daycare, insurance, education, healthcare, etc. etc. have taken a progressively greater share of income leading to fewer and later marriages, fewer and later children, and a general unwillingness to reproduce. All this has led to collapsing populations of young (and now young adults) among the nations that consume over 90% of the worlds exports and ultimately means collapsing demand while excess capacity is set to soar.
So, today I show that of the top 50+ global economies, 6 have rising annual births and childbearing populations, 9 have falling annual births but still have a rising or flat childbearing population (the precursor to depopulation), 35+ have falling births, a falling childbearing population, are in secular decline, and depopulating from the bottom up (negative birth rates coupled with declining childbearing populations). Essentially, global consumer bases are collapsing from the young up, and this situation is only accelerating…and more debt, more QE, more interest rate cuts are only pushing birth rates and total births lower.
We are primarily funded by readers. Please subscribe and donate to support us!
Many will applaud the fast declining and decelerating population growth of the nations that do all the consuming, but we are fast approaching a demographic and economic waterfall among the consuming nations that will leave little to no export led growth potential for poor nations. And that, coupled with increasingly widely available access to birth control, means poor nations economic growth plus (birth rates and total births) are likely to follow the consumer nations down. The likely outcome is a global inverted pyramid with surging elderly populations (and the policies to support them) the cause of collapsing young populations.
The 20 to 40 and 40+ populations of females are not so much projections as simple math, these females already exist and are just shifted forward through the next twenty years assuming existing immigration patterns. Births from 2020 on are projections. Nations are in order of the percentage change of their 20 to 40 year-old female childbearing populations from 2020 through 2040. GDP and % of total global GDP are also included for relativity.
Falling (births falling, childbearing population also declining)
***For those nations with large variations of significantly faster declines among childbearing population than projected in births, I add an estimated dashed line with declining births mirroring declining childbearing populations.
Taiwan (#15 GDP, 0.7%)
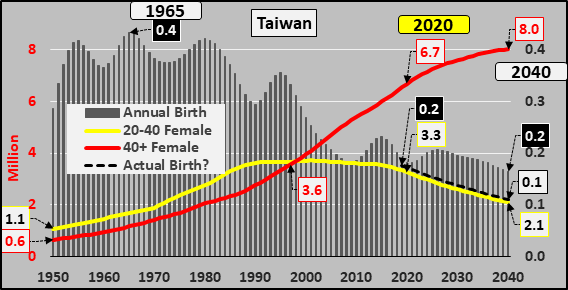
Taiwan 2020 – 2040
20-40 females -1.15 million, -35%
Est. annual births -61k, -35% (UN projects -17k, -10%)
40+ females +1.3 million, +20%
South Korea (#9 GDP, 1.9%)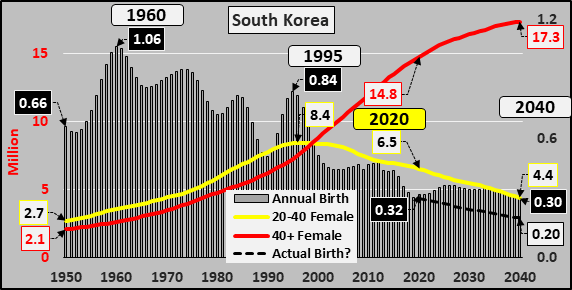
South Korea 2020 – 2040
20-40 females -2.1 million, -33%
Est. annual births -100k, -33% (UN projects -20k, -6%)
40+ females +2.6 million, +17%
Singapore (#21 GDP, 0.4%)
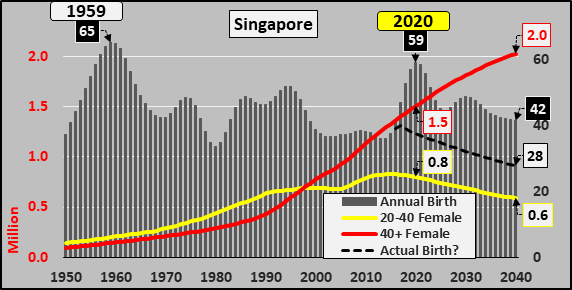
Singapore 2020 – 2040
20-40 females -210k, -26%
Est. annual births -30k, -50% (UN projects -18k, -30%)
40+ females +0.5 million, +34%
Eastern Europe excluding Russia (#13 GDP, 1.2%)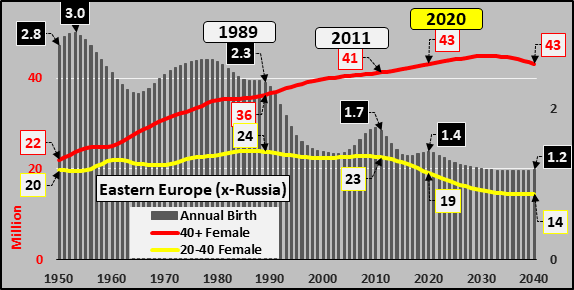
2020 – 2040 (Belarus, Bulgaria, Czechia, Hungary, Poland, Moldova, Romania, Slovakia, Ukraine)
20-40 females -4.6 million, -24%
UN projects annual births -240k, -17%
40+ females, +0, +0%
China (#3 GDP, 16%)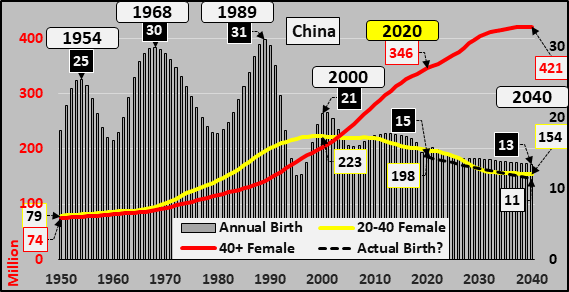
China 2020 – 2040
20-40 females -44 million, -22%
Est. annual births -3.2 million, -22% (UN projects -1.1m, -7%)
40+ females +76 million, +22%
Japan (#4 GDP, 6%)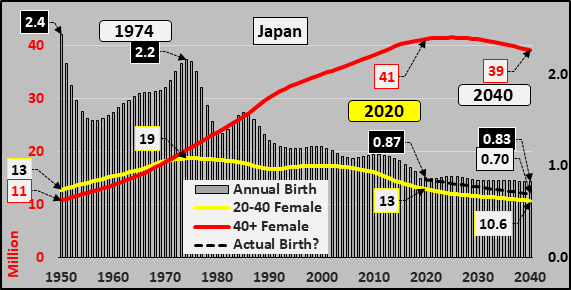
Japan 2020 – 2040
20-40 females -2.3 million, -18%
Est. annual births -155k, -18% (UN projects -40k, -5%)
40+ females -2.1 million, -5%
Thailand (#14 GDP, 0.6%)
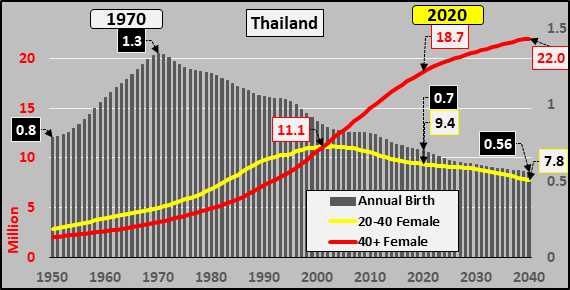
Thailand 2020 – 2040
20-40 females -1.6 million, -17%
UN projects annual births -144k, -21%
40+ females +3.3 million, +18%
Chile (#27 GDP, 0.3%)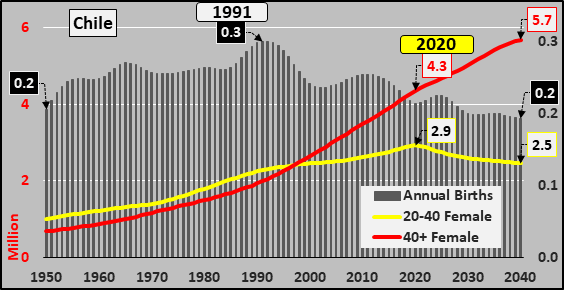 Chile 2020-2040
20-40 Females -470k, -16%
UN projects annual births -20k, -11%
40+ Females +1.3 million, +31%
Russia (#8 GDP, 1.9%)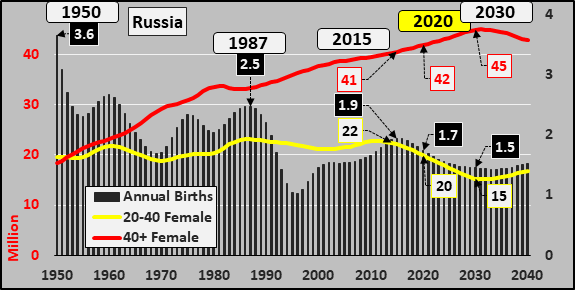
Russia 2020 – 2040
20-40 females -3 million, -15%
UN projects annual births -220k, -13%
40+ females, +1 million, +2%
Vietnam (#29 GDP, 0.3%)
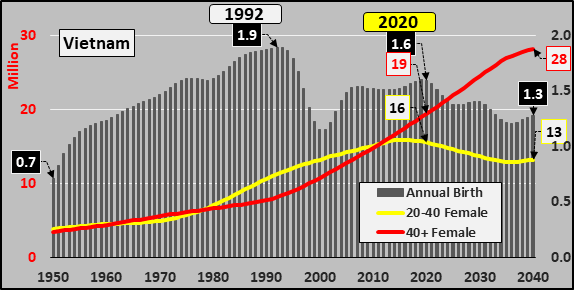
Vietnam 2020 – 2040
20-40 females -2.3 million, -15%
UN projects annual births -320k, -20%
40+ females, +8.8m, +45%
Brazil (#6 GDP, 2.1%)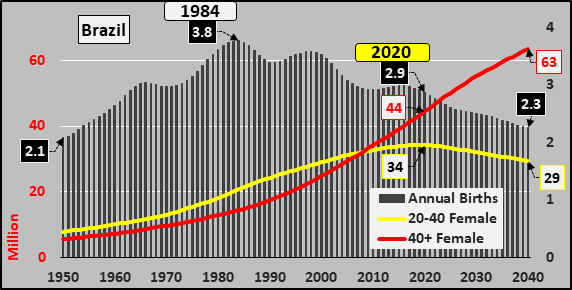
Brazil 2020 – 2040
20-40 females -5 million, -14%
UN projects annual births -620k, -22%
40+ females, +19m, +43%
Iran (#15 GDP, 0.5%)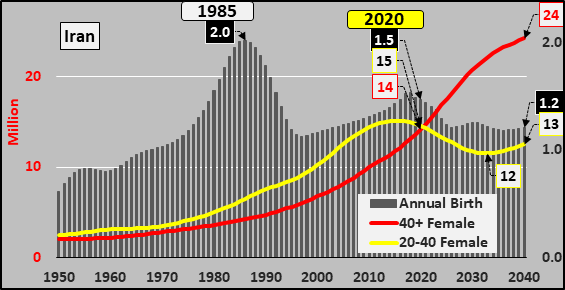
Iran 2020 – 2040
20-40 females -2 million, -14%
UN projects annual births -260k, -14%
40+ females, +10m, +71%
Colombia (#24 GDP, 0.4%)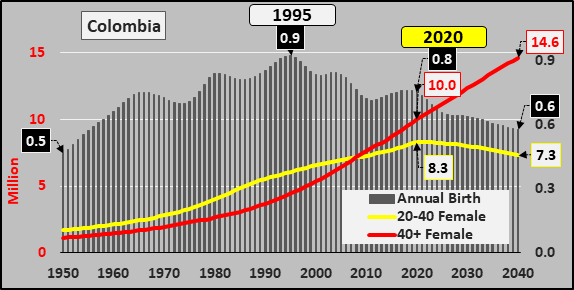
Colombia 2020 – 2040
20-40 females -1 million, -11%
UN projects annual births -175k, -23%
40+ females +4.6 million, +46%
Western Europe (EU+ 29 countries…#2 GDP, 22%)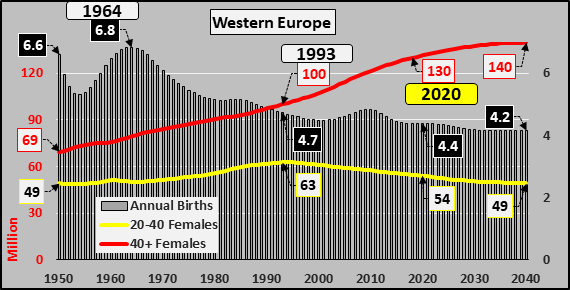
Western Europe 2020 – 2040
20-40 females -5 million, -9%
UN projects annual births -225k, -5%
40+ females, +8 million, +6%
Malaysia (#20 GDP, 0.4%)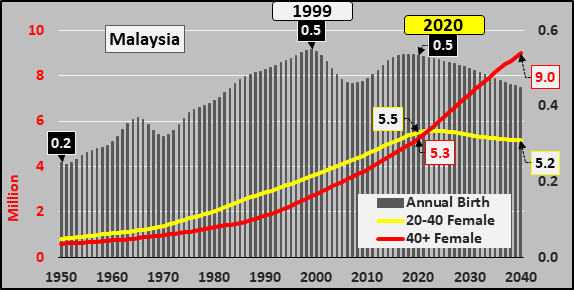
Malaysia 2020-2040
20-40 females -350k, -6%
UN projects annual births -85k, -16%
40+ females +3.7 million, +71%
Turkey (#14 GDP, 0.9%)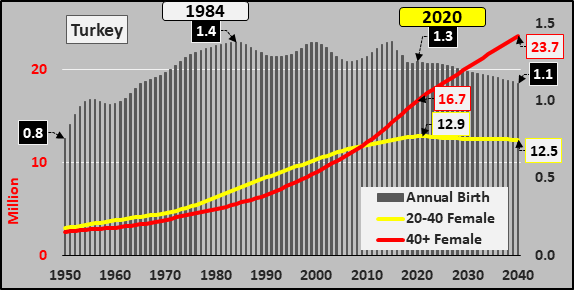
Turkey 2020 – 2040
20-40 females -400k, -3%
UN projects annual births -145, -11%
40+ females +7 million, +42%
Peru (#30 GDP, 0.3%)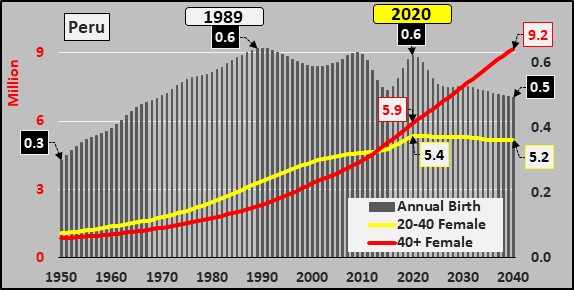
Peru 2020-2040
20-40 females -190k, -3%
UN projected births -130k, -21%
40+ females +3.3 million, +55%
Bangladesh (#25 GDP, 0.4%)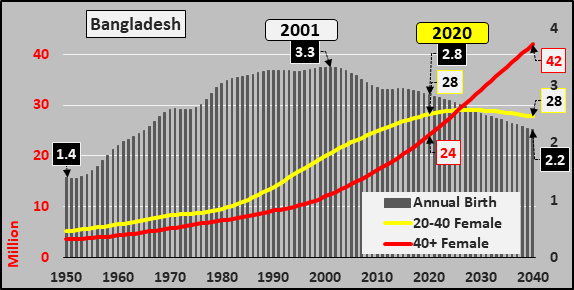
Bangladesh 2020 – 2040
20-40 females -240k, -1%
UN projects annual births -600k, -23%
40+ females, +19 million, +78%
Flattening (Births falling, childbearing population still rising)
South Africa (#22 GDP, 0.4%)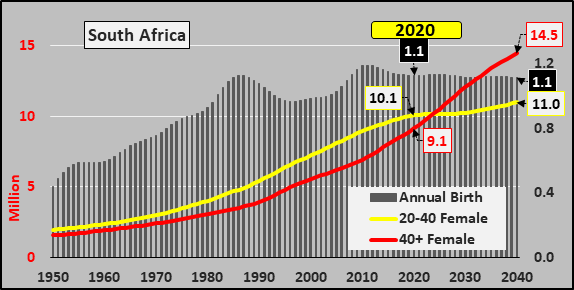
South Africa 2020-2040
20-40 females +0.9 million, +9%
UN projects annual births -10k, -1%
40+ females +5.3 million, +58%
India (#5 GDP, 3.4%)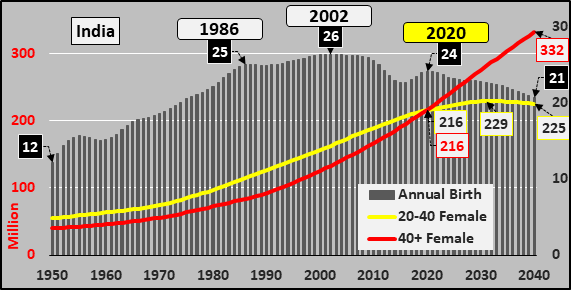
India 2020 – 2040
20-40 females +9 million, +4% (2032 is peak childbearing…down, down from there)
UN projects annual births -3.4m, -14%
40+ females +116 million, +54%
Argentina (#17 GDP, 0.5%)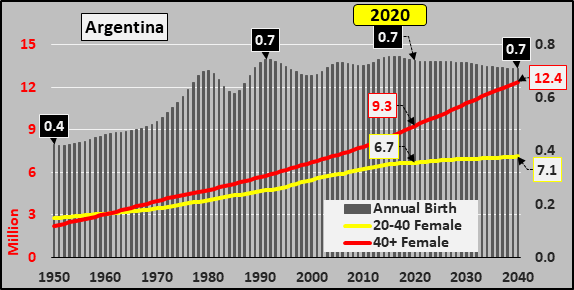
Argentina 2020 – 2040
20-40 females +430k, +6%
UN projects annual births -30k, -4%
40+ females +3.1 million, +34%
Indonesia (#12 GDP, 1.3%)
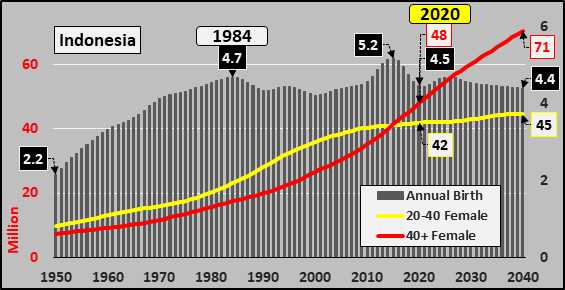
Indonesia 2020 – 2040
20-40 females +2.7 million, +6%
UN projects annual births -88k, -2%
40+ females +22.6 million, +47%
Saudi Arabia (#13 GDP, 0.9%)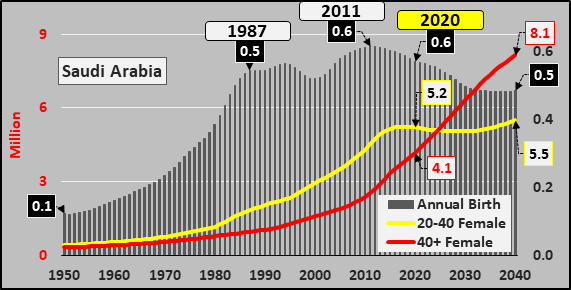
Saudi Arabia 2020 – 2040
20-40 females +280k, +5%
UN projects annual births -90k, -15%
40+ females +4 million, +96%
United Arab Emirates (#18 GDP, 0.5%)
UAE 2020-2040
20-40 females +60k, +4%
UN projects births +6k, 6%
40+ females +500k, 71%
Mexico (#11 GDP, 1.5%)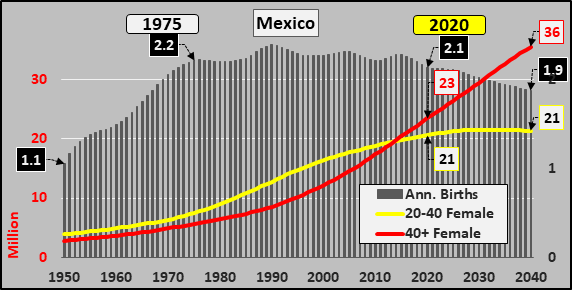
Mexico 2020 – 2040
20-40 females +0.7 million, +3%
UN projects annual births -265k, -12%
40+ females +12 million, +52%
US of A (#1 GDP, 25%)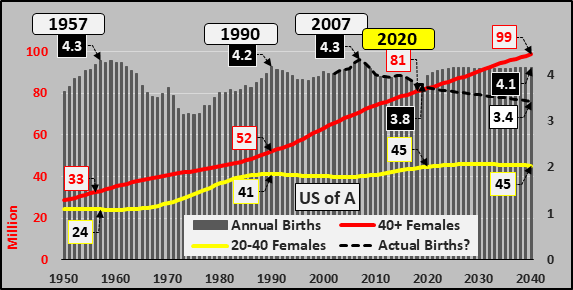
US 2020 – 2040
20-40 females +500k, +1%
Est. annual births -290k, -8% (UN projects +340k, +9%)
40+ females +16 million, +20%
Canada (#7 GDP, 2%)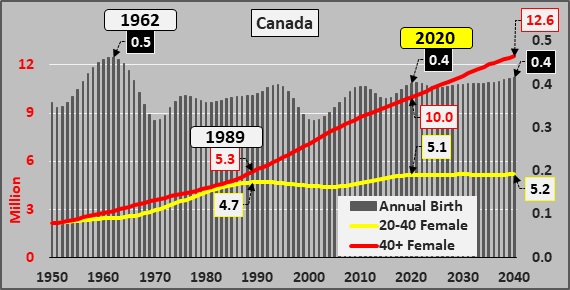
Canada 2020 – 2040
20-40 females +50k, +1%
UN projects annual births +15k, +3%
40+ females +2.6 million, +26%Australia/NZ 2020 – 2040
Growing (Rising births and rising childbearing populations)
Nigeria (#16 GDP, 0.5%)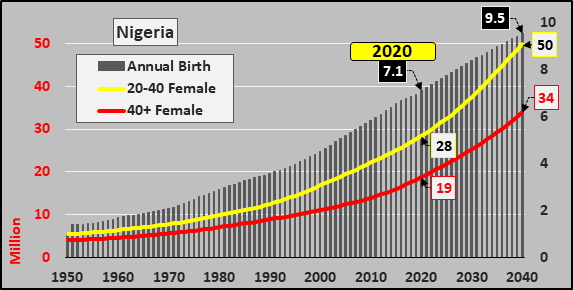
Nigeria 2020 – 2040
20-40 females +21 million, +76%
UN projects annual births +2.4 million, +34%
40+ females +15 million, +81%
Israel (#19 GDP, 0.4%)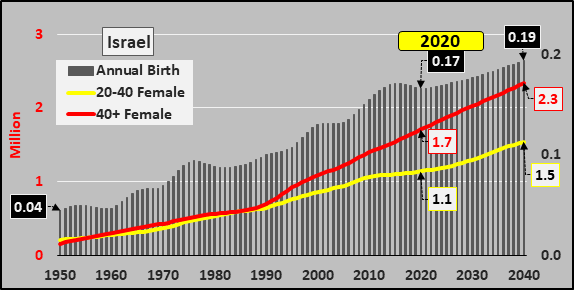
Israel 2020 – 2040
20-40 females +400k, +35%
UN projects annual births +30k, +17%
40+ females +600k, +37%
Egypt (#26 GDP, 0.3%)
Egypt 2020-2040
20-40 females +5.1 million, +33%
UN projects annual births +0.5 million, +24%
40+ females +9.6, +70%
Pakistan (#28 GDP, 0.3%)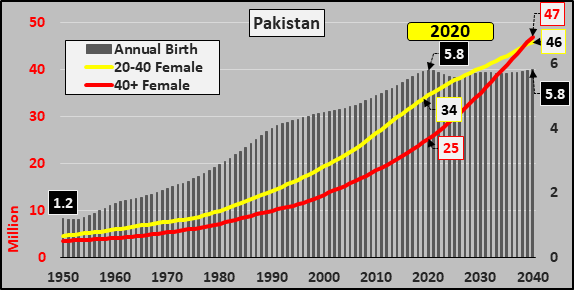
Pakistan 2020 – 2040
20-40 females +11.4 million, +33%
UN projects annual births +20k, +0%
40+ females +22 million, +86%
Philippines (#23 GDP, 0.4%)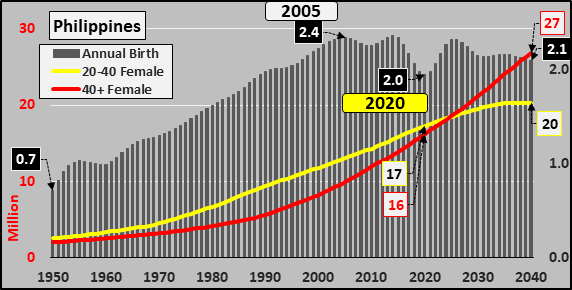
Philippines 2020 – 2040
20-40 females +3 million, +18%
UN projects annual births +145k, +7%
40+ females +10.7 million, +66%
Australia (#10 GDP, 1.6%)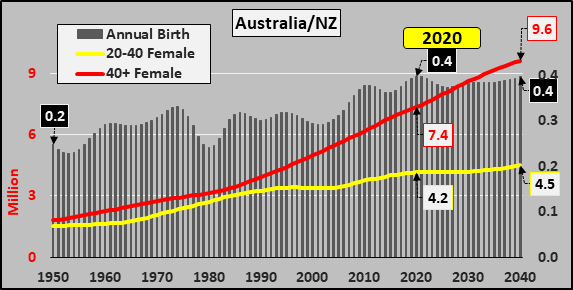
Australia 2020-2040
20-40 females +350k, +8%
UN projects births +0, +0%
40+ females +2.3 million, +31%