Wolf Richter wolfstreet.com, www.amazon.com/author/wolfrichter
After the Bureau of Labor Statistics released its Consumer Price Index for March this morning, including a hotter-than-expected (or feared) reading for the core Consumer Price Index – more on that in a moment – several other inflation gauges were released, all based on various ways of analyzing the data pile of the BLS. This includes the New York Fed’s “Underlying Inflation Gauge,” which hit the highest level since July 2006.
Consumer price inflation is in the eye of the beholder. Every household has its own inflation rate, which varies with what their lives look like: medical expenses, kids in college, renting in a city where rents are soaring, etc. No inflation gauge does justice to that particular reality. But they all show nationwide if watered-down trends.
The New York Fed’s Underlying Inflation Gauge (UIG), an index that was first released in September 2017 based on data going back to 1995, comes in two forms that take a broader look at inflation than any of the other indices (detailed list):
The “prices-only” UIG is based on 242 disaggregated price series of the CPI and the Producer Price Index (PPI), import and export prices, and the Dallas Fed’s “Trimmed-Mean 12-month PCE” inflation. This is comparable to a “core” inflation measure.
The “full data set” UIG incorporates all the data of the “prices-only” UIG plus 103 macroeconomic and financial variables.
In March, the “prices-only” UIG rose 2.23% from a year ago, and the “full data set” UIG rose 3.14%. This chart shows the “full-data set” UIG:
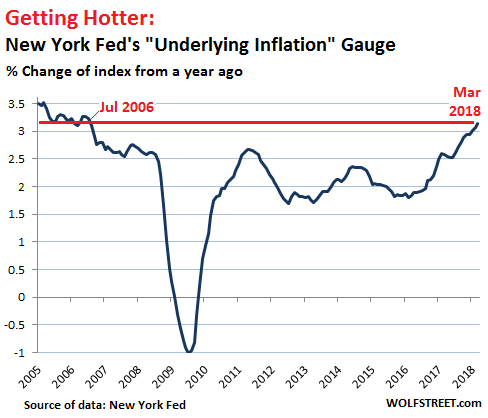
The report by the NY Fed summarizes: “The UIG measures currently estimate trend CPI inflation to be approximately in the 2.2% to 3.2% range.”
By comparison, the Consumer Price Index for “all items,” released today by the Bureau of Labor Statistics, rose 2.4% in March compared to March last year (not seasonally adjusted). This was the sharpest increase in prices since March 2017:
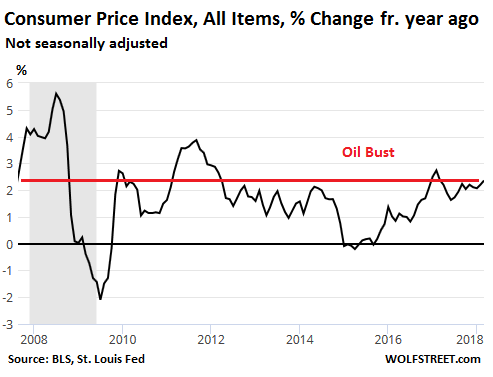
Energy was up 7% from a year ago, with gasoline up 11%, which people have started to notice at the pump. When the all-items CPI surges, it’s usually blamed on food and energy prices, which are volatile. So these prices are eliminated to get a view of “core” inflation. But even core CPI in March rose 2.1% from a year ago, the sharpest increase since February 2017:
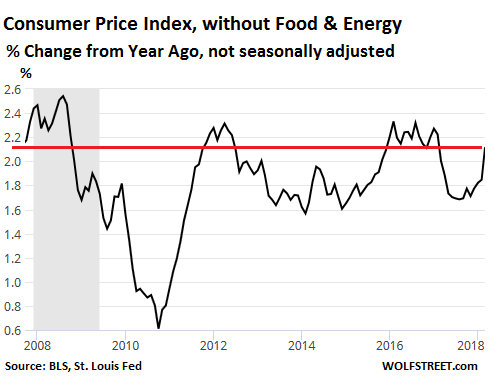
The sub-index for “services less energy” – the biggie, with a relative importance of 59% of CPI – rose 2.9% over the past 12 months. It is comprised mostly of various housing costs, including rent and owners’ equivalent of rent, both of which rose 3.3% year-over-year. Transportation services jumped 4.1%. Medical care services rose 2.1%, with hospital services jumping 5.2%!
The Fed looks at a broad range of inflation data. But its target of 2% is based on the core PCE inflation index, which runs roughly in parallel but usually lower than CPI. So with this CPI release, the Fed is getting more data to support faster rate increases.
In the minutes of the Fed’s meeting on March 20-21, released this afternoon, the Fed already warns of a higher 12-month PCE inflation in the March data, as if to prepare the markets not to get spooked. The 12-month comparison will go back to the “low” inflation period a year ago, which had caused so much hand-wringing at the time. That year-over-year comparison could look ugly, and the Fed doesn’t want the markets to overreact. The minutes:
Several participants noted that the 12-month PCE price inflation rate would likely shift upward when the March data are released because the effects of the outsized decline in the prices of cell phone service plans in March of last year will drop out of that calculation.
So 12-month core PCE inflation for March could spike near or above the Fed’s target? Is that what the Fed is warning about? Either way, the Fed is getting “gradually,” as it always says these days, more serious.
The bullishness of retail investors, measured by how they’re actually positioning their investments in their brokerage accounts, has plunged 39% in three months, more than wiping out the spectacular year-long spike that preceded it. Read… Retail Investor Bullishness Bites Dust after Huge Trump Spike