Wolf Richter wolfstreet.com, www.amazon.com/author/wolfrichter
This is not exactly slow motion anymore.
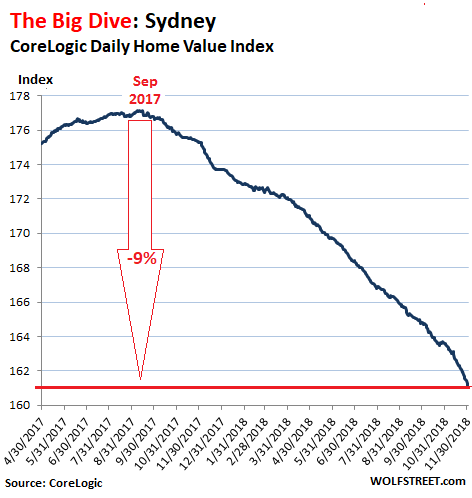
In Greater Sydney, Australia’s largest housing market, the housing bust, after a terrific housing bubble, is gaining momentum. In November, according to the CoreLogic Daily Home Value Index:
- Prices of single-family houses dropped 9.2% year-over-year.
- Prices of “units” (condos) fell 5.5%;
- Prices of all types of dwellings combined fell 8.1%;
The overall index for Sydney, after dropping 1.4% from the end of October to the end of November, is now down 9.0% from its peak in September last year:
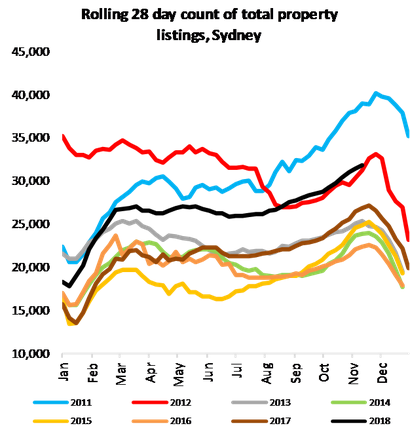
Over the past four weeks, potential sellers – seeing the condition the market is in and hoping for better times – have slowed putting their properties on the market, and the number of new listings over the four-week period has dropped 9.3% from a year ago to just 7,743 properties, the lowest for this time of the year since 2011, according to CoreLogic. However, total listings(new listings plus previously listed properties that haven’t sold yet) rose to 31,859 properties, the most for this time of the year since 2011. The pileup of total listings is happening due to plunging sales volume. CoreLogic:
This indicates that although fewer new listings are hitting the market, the stock that is currently listed is taking much longer to sell and overall listings are mounting as a result.
These potential sellers are going to try to outwait the downturn, which they assume is just a brief dip. This chart shows the total listings for 2018 (black line), compared to prior years (top blue line = 2011 via CoreLogic):
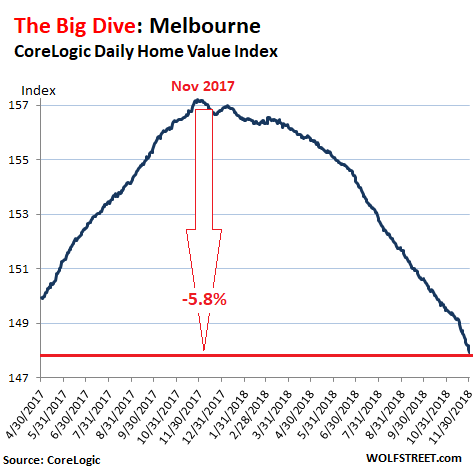
Greater Melbourne, the second largest housing market in Australia, has been lagging behind Sydney by a couple of months in the development of its housing bust. Its peak occurred in November 2017. But by now, the bust is well on its way. According to the CoreLogic Daily Home Value Index:
- Prices of single-family houses dropped 7.6% year-over-year;
- Prices of “units” fell 1.7%;
- Prices of all types of dwellings combined fell 5.8%.
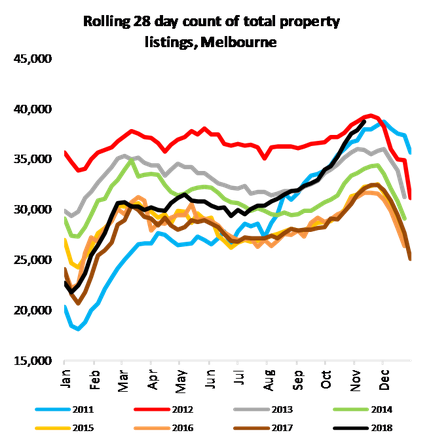
While new listings in Melbourne fell 5.6% from a year ago, to 9,714, as potential sellers are holding back putting their properties on the market in hopes for better times, total listings jumped 19.3% from a year ago to 38,730, the highest level since 2012, and higher than 2011 — highlighting “the difficulty in achieving sales currently,” CoreLogic pointed out (the black = 2018, chart via CoreLogic):
CoreLogic notes:
Overall as the housing market weakens and properties take longer to sell, the total volume of stock listed for sale is increasing. Encouragingly in terms of mortgage stress and potential arrears we are not seeing a significant dumping of new stock onto the market. If anything, in Sydney and Melbourne vendors are realizing that it is an inopportune time to sell and fewer vendors are now listing. Of course, this is not to say things can’t change and it is expected that total listings will continue to climb and selling homes will take longer.
In the other capital cities, property prices were mixed in November, compared to a year ago:
- Brisbane, Queensland: +0.3%
- Adelaide, South Australia: +1.4%
- Perth, Western Australia: -4.2% and are down 14% from their peak in 2014, following the mining bust.
- Darwin, Northern Territory: -0.8%; prices have been on the decline since the peak in 2014.
- Canberra, Australian Capital Territory: +4.0%
- Hobart, Tasmania: +9.3%
The sharp downturns in Sydney and Melbourne can be blamed on the confluence of several factors:
- An onslaught of supply from the construction boom;
- A crackdown on the banks’ mortgage shenanigans that were exposed in the media and eventually by the Royal Commission investigation;
- Tighter credit availability;
- Very stretched housing affordability following years of price gains that formed one of the most magnificent housing bubbles the world has seen;
- And the sudden reluctance of speculators to pile into the market – including non-resident Chinese investors. They’re getting hammered by the morale-crusher of sinking prices, higher mortgage rates for investors, and a crack-down on interest-only mortgages. Chinese buyers are having to jump over the additional hurdle of tighter capital controls in China.
And this is happening even as GDP has grown 3.4% compared to a year ago, and as the unemployment rate – at 5.0%, the way Australia measures it – is at the lowest level since 2012. So these are still the good times. This housing bust has not been caused by waves of people losing their jobs. Any future weakness in the economy will only add to the housing bust.