Wolf Richter wolfstreet.com, www.amazon.com/author/wolfrichter
After the blistering spike earlier this year.
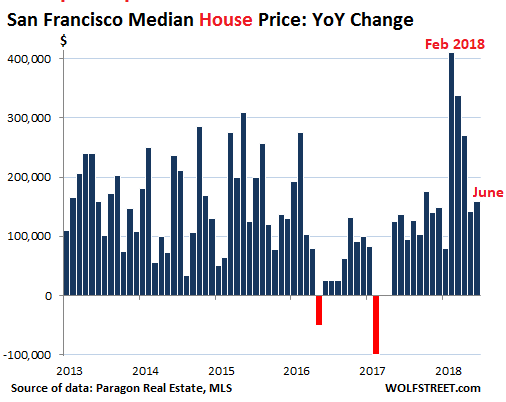
In San Francisco, the median price of a single-family house (we’ll get to condos in a moment) soared by 11% in June compared to a year ago, or by $159,000, to $1.62 million.
That surge, as crazy as it seems, is mild compared to the kind of heck that had broken loose in February, when the median price of a single-family house spiked 32% year-over year, or by $410,000, to a still standing record high of $1.7 million. For a median house, which is nothing special in San Francisco!
Median price means half of the homes were sold at prices above it, and half at prices below it. June data reflects closings in June.
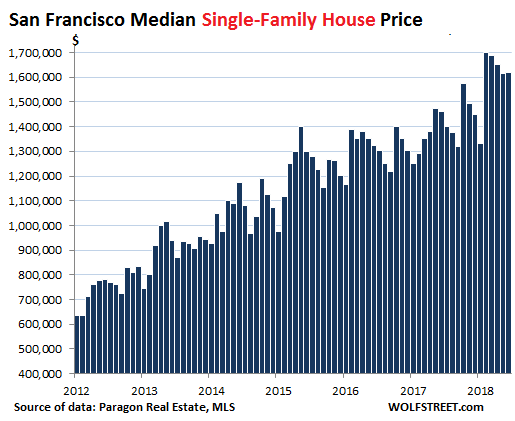
But in those four months since that February spike, the median price of a single-family house has fallen by $80,000. A price decline in the spring is not uncommon. Over the six-and-half years since January 2012, the median house price has ballooned by 155%:
San Francisco, which has the second-highest population density in the US behind New York, is a city of multi-family buildings. In recent decades, nearly all new construction has been condos and rental apartments, and practically no single-family houses have been built. By now, condo sales – in which I include the small number of sales of TICs (tenancy in common) and co-ops – represent 58% of the market. On average per month this year, 249 condos were sold, compared to 177 single-family houses. It doesn’t take a lot of sales at the high end to shift the mix upward and move the price needle.
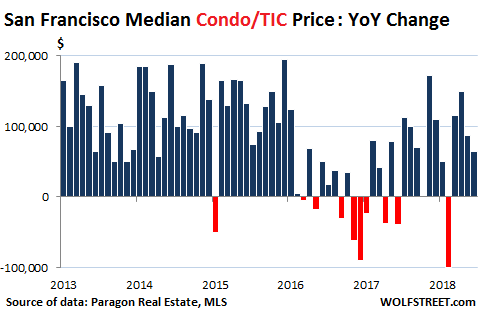
Condos had been flat-lining since early 2015, with major ups and downs in between. The construction boom is putting a lot of new units on the market, nearly all of them high-end. And there have been some sharp year-over-year price declines. The last one occurred in February, when the median condo price plunged 8% year-over-year, or by $100,000, to $1,085,000.
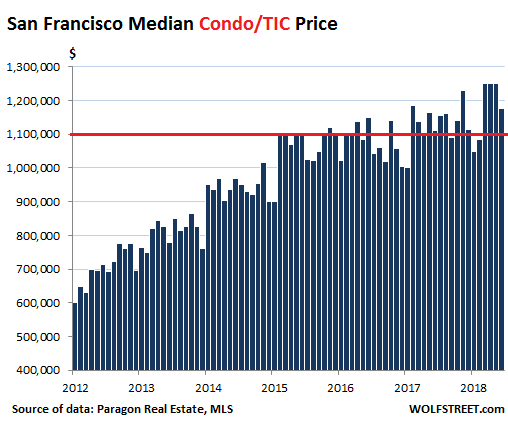
But in March, the median price surged 10% year-over-year, or by $114,750, to a record $1.251 million. That record still stands, and the median price has since then dropped by $76,000 to $1.176 million.
The chart below shows the year-over-year price changes. Note the accumulation of red in 2016 through June 2017:
And this chart shows the median condo/TIC prices over time. June’s median price of $1.176 million is now down $54,000 from November:
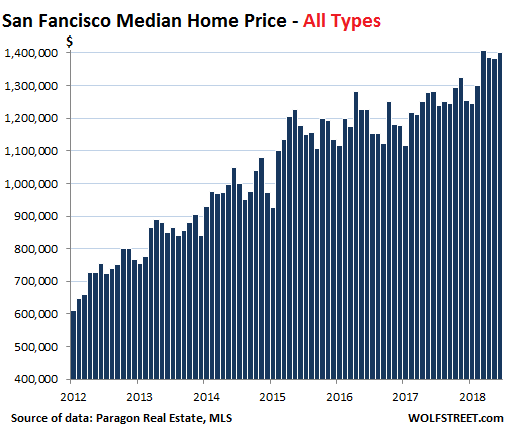
The median price of all types of dwellings combined jumped 9% year-over-year, or by $120,000, to $1.4 million, though this was down a smidgen from the peak in March. Since January 2012, the combined median price has skyrocketed 130%:
Patrick Carlisle, Chief Market Analyst at Paragon Real Estate Group, who provided the data, explained:
The second quarter of 2018 saw the highest quarterly number of SF homes selling for $2 million and above: When late-reported sales are entered into MLS, we expect the total to be over 320 for the 3-month period, far exceeding the previous high of 267 sales in Q2 2017. Monthly luxury condo sales in particular hit a new monthly peak for sales volume in May 2018.
By any measure, the heat of the San Francisco market in the first half of 2018 has been among the most blistering ever. Probably only 3 or 4 other periods over the past 50 years have seen a comparable intensity of buyer demand vis a vis the supply of listing inventory available to purchase. This despite both significant increases in interest rates and changes in federal tax law severely limiting the deductibility of mortgage interest and property tax costs. As mentioned before, the market is particularly ferocious in the lower and middle-price segments of house sales.
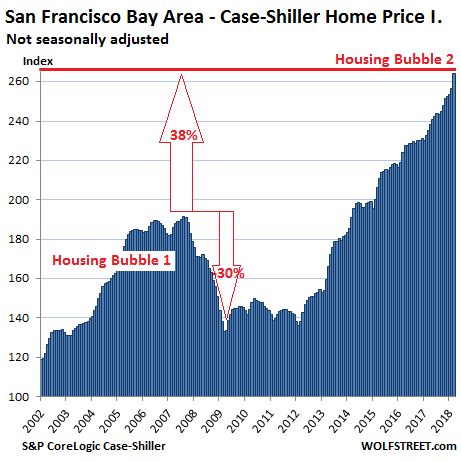
This boom in median prices far outpaces the already steep increases reflected in the Case-Shiller Index for “San Francisco.” The Case Shiller index for “San Francisco” jumped 11% from a year earlier, as I reported on June 26 [It Gets Spiky: The Most Splendid Housing Bubbles in America].
And since January 2012, the Case-Shiller index has soared 89%.
But wait… over the same period, the median price in San Francisco for all types of dwellings combined, as reported above, has skyrocketed 130%.
So there are a few things to note in this comparison:
- The Case-Shiller index for “San Francisco” covers the counties of San Francisco, Alameda, Contra Costa, Marin, and San Mateo (San Francisco plus the northern part of Silicon Valley, part of the East Bay, and part of the North Bay). By contrast, the median prices cited above are for the city (=county) of San Francisco only.
- The Case-Shiller index is based on a rolling three-month average. The release on June 26 was for sales that occurred in February, March, and April. So it lags median-price data by several months.
- The Case-Shiller index is based on “home price sales pairs,” comparing the current sales price of a home to the price of the last transaction of the same home years earlier. The index incorporates other factors and uses algorithms to calculate data points. Thus, the index is not susceptible to shifts in the mix, which is one of the weaknesses of median prices.
- The Case-Shiller, as an index (set at 100 for January 2000), only shows changes in the index value; it does not show actual price levels or price changes in dollars, something that median prices do well.
As they say, results may vary.
San Francisco’s housing market is dependent on an ebullient stock market – rich payouts via stock-based compensation packages – and on the community of venture capital and other funds that plow money into startups, and on Corporate America that buys those startups for ludicrous amounts of money, thus creating lots of instantly rich employees – only to shut them down quietly a little later in many cases. This is global money that is washing tsunami-like over San Francisco during boom times, and it recedes tsunami-like during the busts that have become legendary in San Francisco.