via UPFINA:
With the disappointing new home sales report we discussed in a previous article and the disappointing headline durable goods orders reading we will discuss in this article, the U.S. economy has seen a continuation of economic reports not meeting estimates. As you can see from the chart below, the U.S. economic surprise index is at -68.1 which is near the low for the year.
Michael Kantrowitz notes that the US eco surprise index is making multi-yr lows and while the equity market may look like it’s “ignoring it” on the surface, small caps, cyclicals, and value are massively underperforming. #stocks #bonds pic.twitter.com/ZidovaPHyn
— Cornerstone Macro (@csm_research) June 26, 2019
It’s not close to the big decline in 2011, but it’s far from good. To be clear, missing estimates doesn’t directly equate to weakness because estimates can be high. However, in this case most economists know the economy is in a slowdown, but results still aren’t matching estimates.
Negative Surprises Are Common
After the latest economic results, the Atlanta Fed GDP Nowcast lowered its Q2 GDP growth guess from 2% to 1.9%. Goldman Sachs raised its estimate from 1.4% to 1.5%. Finally, Bank of America lowered its estimate by 0.6% to 1.9%. It seems likely growth will fall from Q1’s rate, but if inventories and trade don’t help the headline reading, Q2 could have stronger underlying results than Q1. As much desire some have to call for a recession after avoiding one for 10 years, the Q2 advanced GDP report probably won’t signal the economy was in a recession. The economy has successfully outlasted the 1990s expansion.
May Durable Goods Orders Signals Slowdown Still In Place
The chart below does a great job of showing you how the economy can be in a slowdown without a recession.
Durable Goods Orders pic.twitter.com/8GARIC1jW0
— J. Brett Freeze, CFA (@Techs_Global) June 26, 2019
Results aren’t even as bad as they were in the 2015-2016 slowdown. However, they are headed in the wrong direction which is an issue especially if there isn’t a trade deal soon. Monthly May durable goods orders, which were hurt by aircraft orders, were down 1.3% which missed estimates for a 0.1% decline. The April decline was revised from 2.1% to 2.8%, making matters worse. Yearly growth fell from -0.7% to -2.8%.
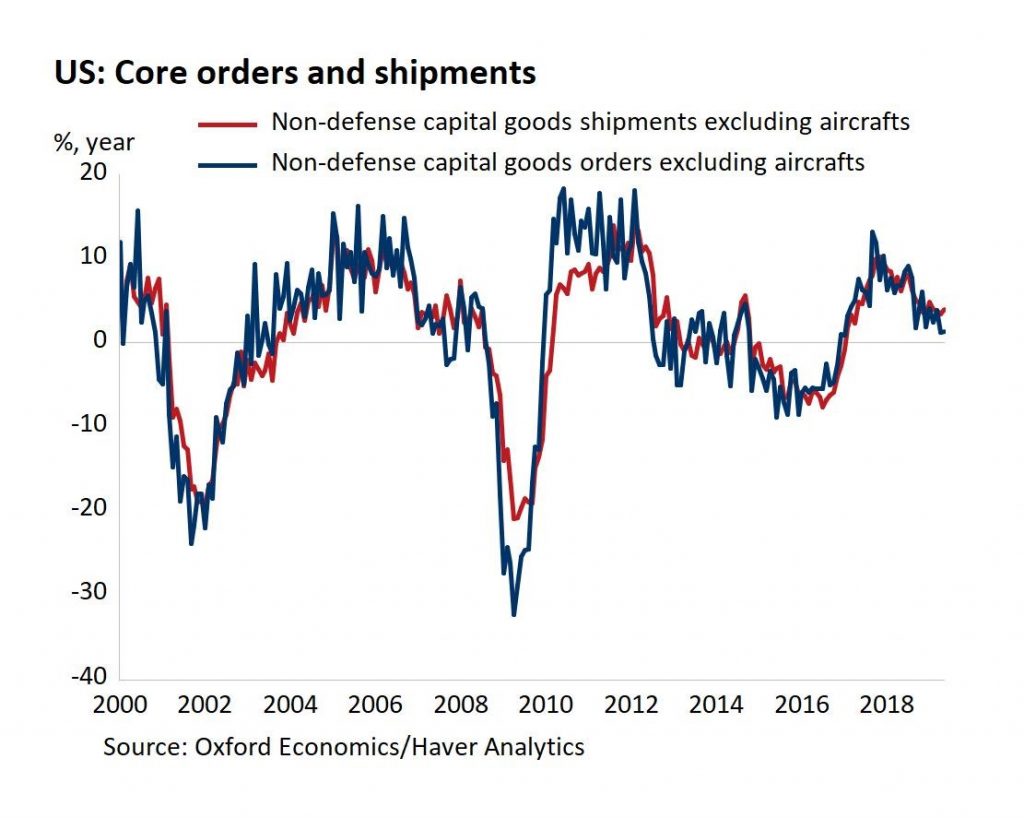
The monthly results ex-aircraft orders look better, but that’s partially because of weak comps. Monthly ex-transportation growth was 0.3% which beat estimates for 0.1% and the April decline of 0.1%. Core capital goods orders were up 0.4% monthly which doubled estimates and was on top of the 1% decline in April. As the chart above shows, non-defense ex-aircraft durable goods orders growth was just 1.3% yearly; that’s up from 1.2% in April. Yearly core shipments growth was solid as it was 4% as you can see from the chart below.
Since overall inventories rose 0.5% and overall shipments rose 0.4% the inventory to shipments ratio stayed at a favorable 1.67. Further good news is motor vehicles and parts orders increased 0.6% monthly. Year to date they are up 7.5%.
Interestingly, the value of new orders for consumer goods excluding defense was down 2.7% which is worse than the 2.5% decline in April. It’s the worst reading since November 2016. The weakness in aircraft orders was caused by the grounding of Boeing’s 737 Max plane. New orders for defense and aircraft parts fell 11.7% yearly. New orders for non-defense aircraft and parts fell 65.7% yearly. That’s the worst decline since June 2016.