by SpontaneousDisorder
(at least the history on this chart, just realized the title could be slightly misleading)
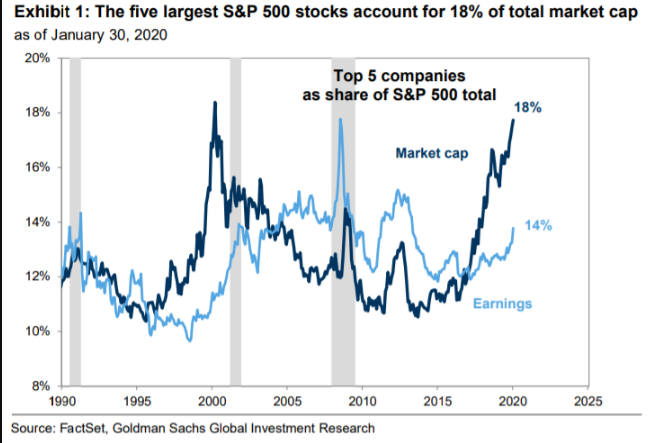
So the last time it was this high was during the dot com bubble. The stock bull market is narrow with fewer participants rising in value.
This is another way to look at this breadth. The Equal weight S&P500/S&P500 (which is basically market cap weighted). This ratio has been plummeting.
Another look at divergence. Look at the divergences leading up to the 2000 and 2007 peaks….
Another look at divergence: When we break S&P 500 members into 10% deciles by price-to-sales multiples, the top 5 deciles have increased since early 2018, while the lowest 5, despite a retreat since then, are still beyond every previous bull market peak in history, including 2000 https://t.co/ksMg3xGUHK pic.twitter.com/Ya0GJ8bS1u
— John P. Hussman, Ph.D. (@hussmanjp) February 8, 2020