by Chris Kimble
If you spend time researching market relationships you can better understand money flows, rotation, and reasons why money flows rotate. This can be very helpful in identifying trend changes as well.
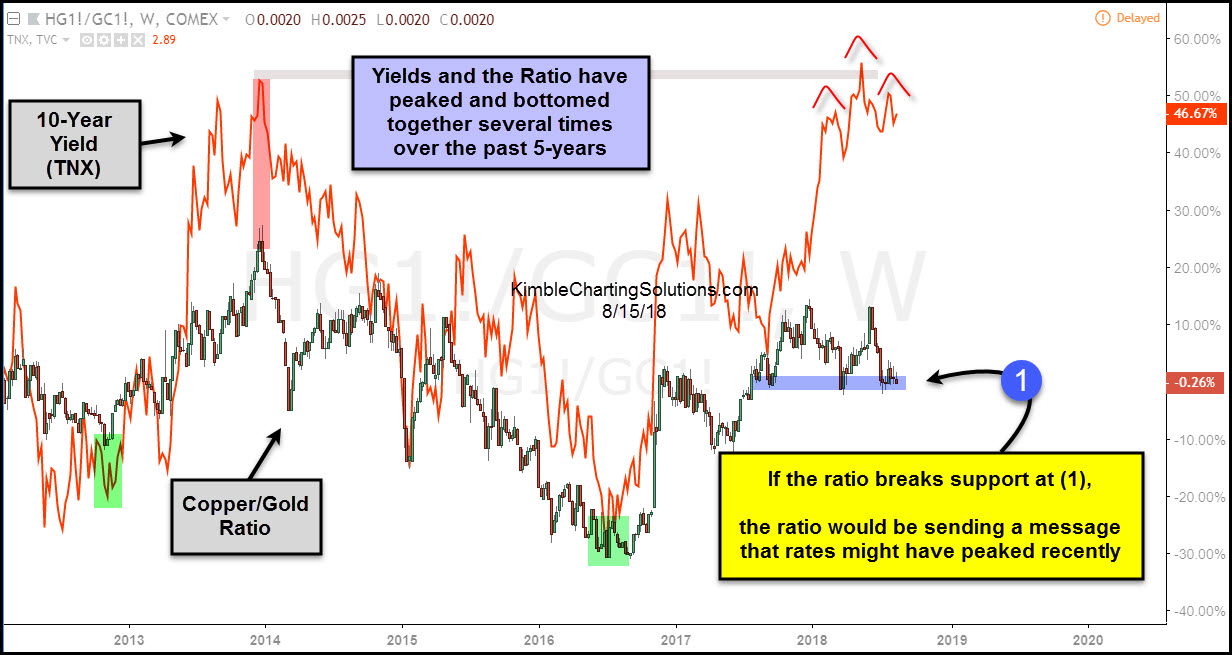
Interest Rates Peaking?
Looking at the chart below, we can see that treasury yields and the Copper/Gold ratio tend to peak and bottom together – this has occurred several times over the past 5 years.
Currently, the 10 Year Yield is forming a bearish head and shoulders pattern (in red) at the same time that the Copper/Gold ratio is testing important support (point 1).
If the ratio breaks the support at point 1, it would send a message that interest rates might have peaked for the near-term. Pay attention here!
Treasury Yields vs Copper/Gold Ratio Chart
CLICK ON CHART TO ENLARGE
This article was originally written for See It Markets.com. To see the original post, CLICK HERE