Wolf Richter wolfstreet.com, http://www.amazon.com/author/wolfrichter
This Fed is getting seriously hawkish: It revealed that instead of thinking about backing off rate hikes, it’s replacing the yield curve.
In the minutes of the FOMC meeting on June 12 and 13, released this afternoon, there was a doozie, obscured somewhat by the dynamics of the rate hike plus the indication that there would be two more rate hikes this year, for a total of four, up from three at the prior meeting, with more hikes to come in 2019, along with other changes – a phenomenon I called, This Fed Grows Relentlessly More Hawkish, Gone are the Kid Gloves.
But the doozie in the minutes was about the flattening “yield curve.”
The yield curve is formed by Treasury yields of different maturities: normally, the two-year yield is quite a bit lower than the 10-year yield. Over the last several decades, each time the yield curve “inverted” – when the two-year yield ended up higher than the 10-year yield – a recession followed. The last time, the Financial Crisis followed.
So this has become a popular recession indicator that has cropped up a lot in the discussions of various Fed governors since last year. Today, the two-year yield closed at 2.55% and the 10-year yield at 2.84%. The spread between them was just 29 basis points, the lowest since before the Financial Crisis.
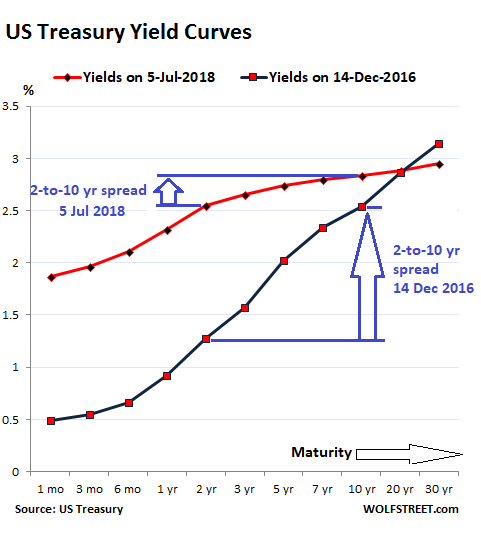
The chart below shows the yield curves on December 14, 2016, when the Fed got serious about raising rates (black line); and today (red line). Note how the red line has “flattened” between the two-year and the 10-year markers, and how the spread has narrowed to just 29 basis points:
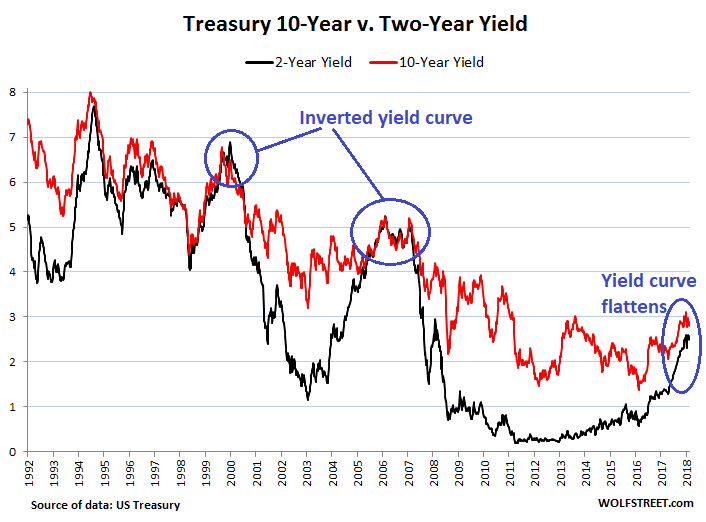
The chart below shows the two-year yield (black) and the 10-year yield (red) going back to 1992. Note how the spread has been narrowing in recent months (click to enlarge):
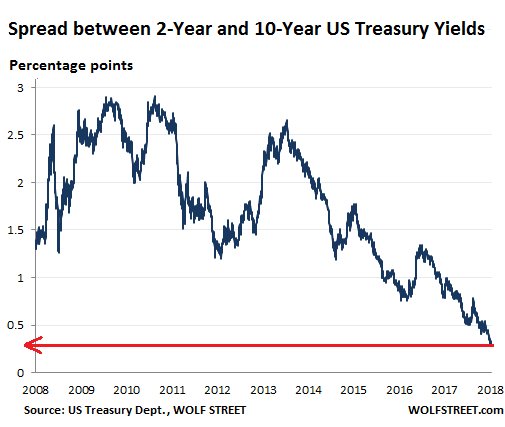
The chart below tracks this spread for every day back to 2008. Today, the spread, at just 29 basis points, is the lowest since before the Financial Crisis:
There has been a lot of handwringing about this being an indicator that the next recession is nearing and that the Fed should back off with its rate hikes.
But this Fed is getting seriously hawkish: In the minutes today, it revealed that instead of thinking about backing off with its rate hikes, it’s throwing out the flattening yield curve.
It explained what factors – in addition to the “gradual” rise in the federal funds rate, as per the Fed’s rate hikes – cause the yield curve to flatten that make it unreliable as a recession indicator:
- A “reduction in investors’ estimates of the longer-run neutral real interest rate”
- “Lower longer-term inflation expectations”
- “Lower level of term premiums in recent years relative to historical experience reflecting, in part, central bank asset purchases” – meaning that QE are artificially repressing long-term yields in relationship to shorter-term yields.
And according to “some participants,” these types of factors “might temper the reliability of the slope of the yield curve as an indicator of future economic activity,” the minutes said.
In other words, the Fed’s massive balance sheet, nine years of near-zero interest rate policy, and other factors might be distorting investors’ thinking. And this distorted thinking causes investors to pile into long-term Treasuries at these low yields, and thus push down these yields further.
Hence, the “information content” of the yield curve – the signals of a coming recession – might be distorted.
There was no consensus among FOMC members about the lack of “reliability” of the yield curve as a predictor, but there was a “staff presentation” about a new recession indicator to replace the yield curve:
This new indicator – rather than looking at the spread between longer-term yields of two years and 10-years – is looking at the spread between short-term yields. It’s “based on the spread between the current level of the federal funds rate and the expected federal funds rate several quarters ahead derived from futures market prices.”
The staff noted that this measure may be less affected by many of the factors that have contributed to the flattening of the yield curve, such as depressed term premiums at longer horizons.
This “staff presentation” took place during the meeting on June 12 or 13. On June 28, the Federal Reserve Board published a note that explained in greater detail why this new recession indicator would be superior to the yield curve.
The note by two staff economists, Eric Engstrom and Steven Sharpe, tracks the market’s expectations of the next rate cut, based on the logic that the Fed will cut rates when the next recession begins.
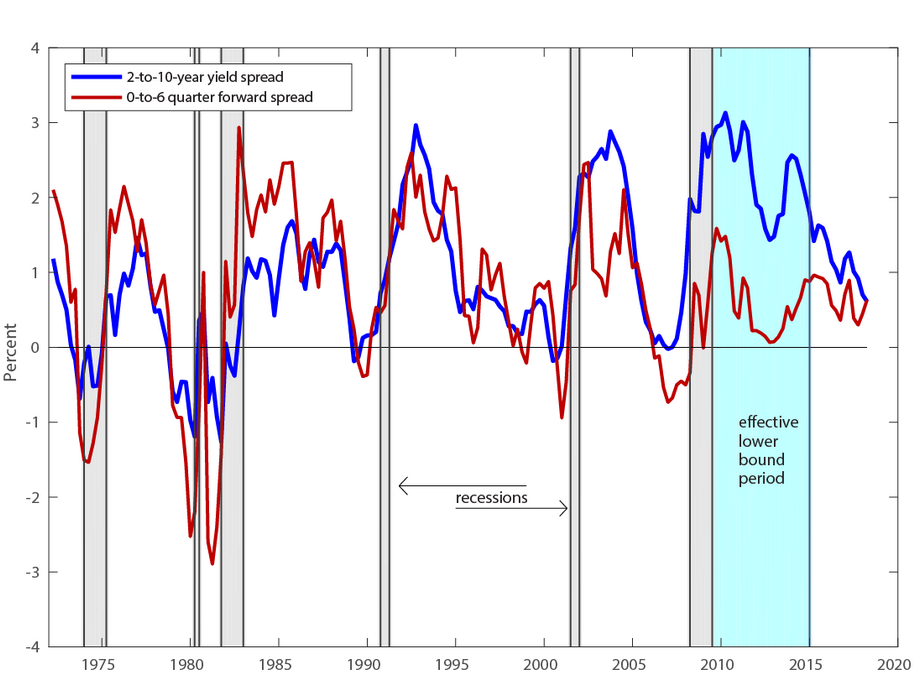
The note included the chart below that compares the “long-term spread model” (the yield curve, blue line) to the new “near-term spread model” (red line). It shows that the new model accurately predicted the last five recessions, similar to, but perhaps slightly better than, the yield curve. This occurs when the lines drop toward and below zero. The chart also shows that the spread of the new model is well within range of the past few years and pointing in the right direction (up), while the spread of the long-term yield curve is at the lowest point in 10 years and seriously pointing in the wrong direction (click to enlarge):
To convert this into an indication of recession probability expressed in percent, as the market sees it, the Fed economists offer the chart below (click to enlarge):

It shows how the yield curve (blue line) is indicating a rising probability of a rate cut – the sign of a recession – while, according to the new indicator, “the market is putting fairly low odds” on this scenario.
So just in the nick of time, with the spread between the two-year and the 10-year yields approaching zero, the Fed begins the process of throwing out that indicator and replacing it with a new indicator it came up with that doesn’t suffer from these distortions.
And I have to agree that the Fed’s gyrations over the past 10 years have distorted the markets, have muddled the calculations, have surgically removed “fundamentals” as a consideration for the markets, and have brainwashed the markets into believing that the Fed will always bail them out at the smallest dip. And the yield curve, reflecting all those distortions to some extent, might have become worthless as an indicator of anything other than those distortions.