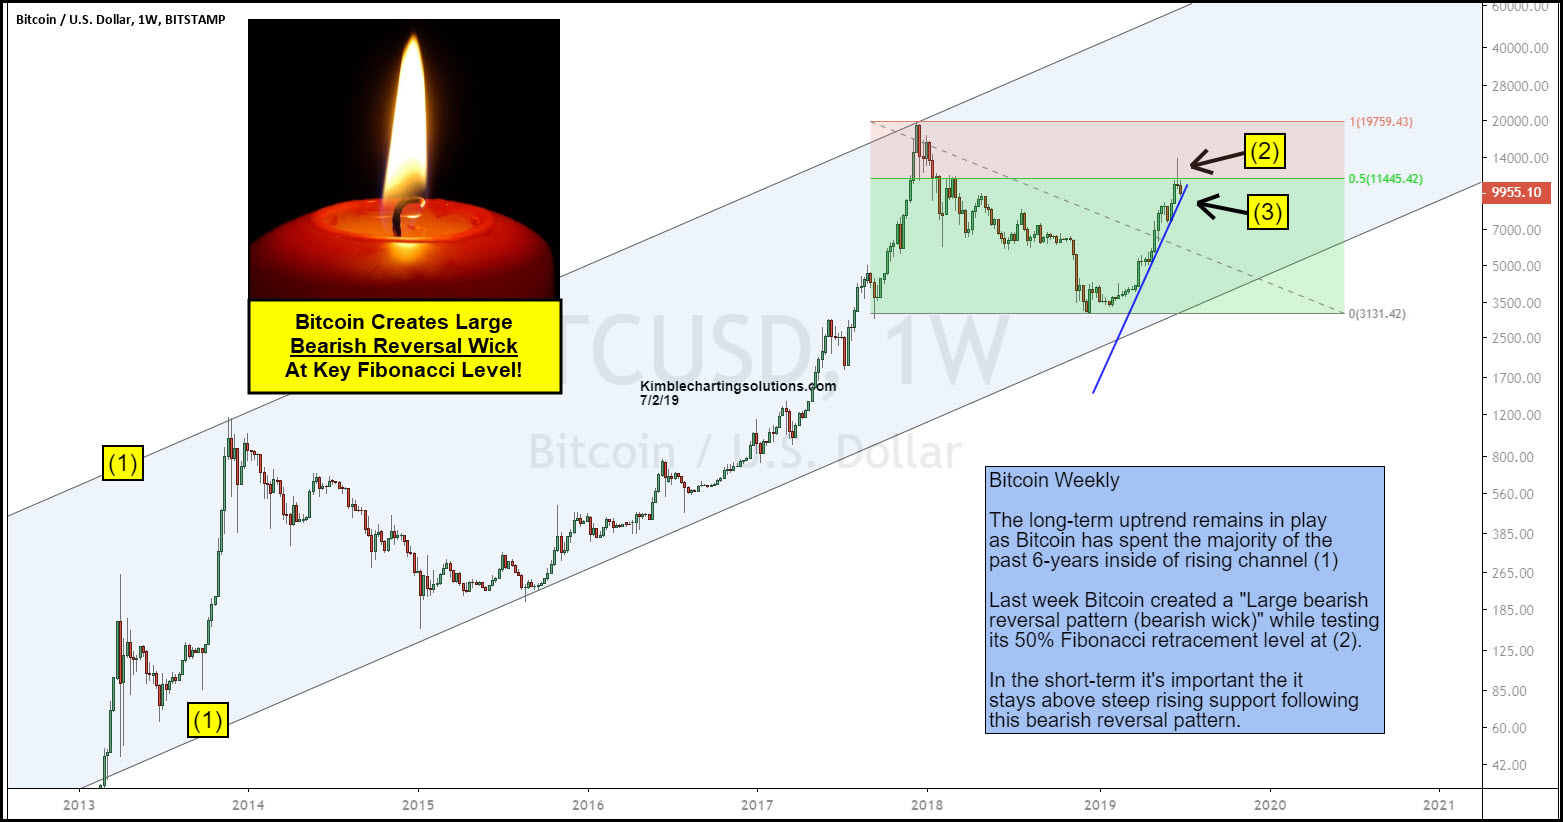
The chart looks at Bitcoin on a weekly basis over the past 6-years. The long-term trend remains up, as it continues to create higher lows inside of rising channel (1. This pattern has been taking place since the 2013 lows.
We applied Fibonacci retracement levels to the 2017 highs and 2018 lows. The rally off the 2018 lows saw Bitcoin hit its Fibonacci 50% retracement of the large decline.
While testing the key Fibonacci retracement level, it created a large bearish wick pattern (Bearish reversal pattern) at (2), while attempting to close above the 50% level.
In the short-term, it looks to be very important that Bitcoin remains above rising support at (3). If this support would fail to hold after this large bearish reversal pattern, odds increase that it will experience some selling pressure in the short term.