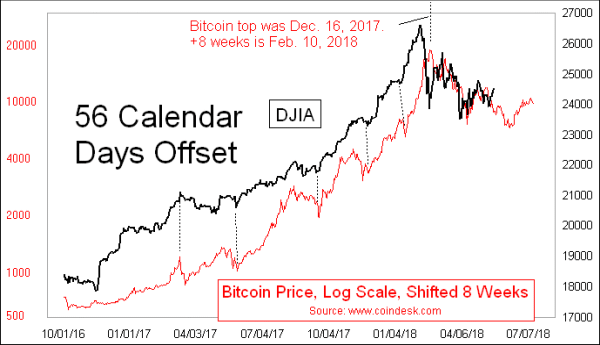
Back in January, I introduced readers to the revelation that all throughout 2017, the DJIA had been following in the footsteps of Bitcoin prices, with a lag time of about 8 weeks (56 calendar days). And it continues working even now, albeit with a slight adjustment.
Why would this relationship work? My answer is that there are cycles of human emotion which affect our collective attraction to and repulsion from speculative investments like the stock market. It appears that those same cycles of trader emotion are at work on Bitcoin traders, who are feeling those surges and lags in enthusiasm before they reach the hearts of stock investors.
The relationship did not seem to begin working until late 2016, which was when Bitcoin prices first touched $1000 and started getting people really excited. The 56-day lag time should have meant a Feb. 10, 2018 top for the DJIA, based on a calculation of 56 calendar days from Bitcoin’s Dec. 16, 2017 all-time price top.

But instead the DJIA topped on Jan. 26. So what happened? My best guess is that the commencement of Bitcoin futures trading on Dec. 15, 2017 may have bent the path of its price action somewhat, thereby disrupting the relationship, sort of like how the huge mass of the planet Jupiter can affect the orbital paths of the lesser planets, and create tides in the sun. And the arrival of bearish traders who finally had a way to short Bitcoin efficiently affected that market, and may have also affected how speculators were feeling about stocks too.
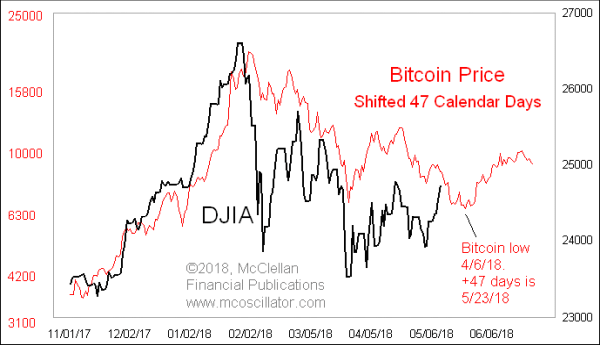
Because of that misalignment of the blowoff tops in Bitcoin and the DJIA, I adjusted the comparison several weeks ago, shortening the price offset to just 41 calendar days. That put the DJIA’s Jan. 26 top in alignment with Bitcoin’s December top. This new alignment seemed to work for a while during late January to early February, but lately it seems to be getting out of phase. The disruption from the introduction of Bitcoin futures appears to be fading in its influence. Right now, a lag time of 47 calendar days seems to best fit the current DJIA price data to Bitcoin’s earlier patterns. It may perhaps eventually work its way back to the 56-day offset which applied in 2017.
If this relationship stays settled into this 47 calendar day lag that the top chart shows, then that implies a decline for stocks toward a bottom due May 23, and then a rebound into June. But I would advise against basing one’s entire trading plan on a leading indication relationship that did not even work until just over a year ago, and which has been somewhat quirky since then.
Tom McClellan
Editor, The McClellan Market Report