Wolf Richter wolfstreet.com, http://www.amazon.com/author/wolfrichter
Madrid, Barcelona, other markets are well on their way. But some markets are still crushed.
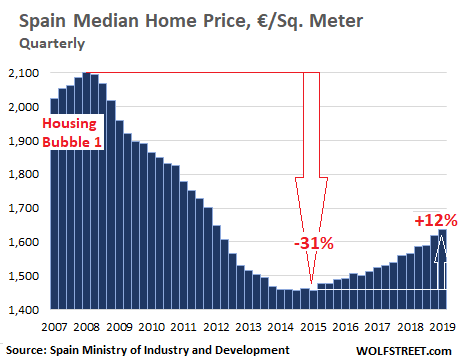
Spain’s last epic housing bubble, one of the biggest in living memory, propelled median home prices to €2,100 per square meter, at which point the bubble began to burst. The national median price eventually plunged 31%, according to government data, as Spain’s financial system began to collapse only to get bailed out by an international aid package. The long-drawn-out event wreaked all kinds of mayhem on the economy, workers, and the people. So where is the housing market now?
The median home price in Spain increased by 4.4% year-on-year in the first quarter of 2019, compared to the same period last year, to €1,636 per square meter (to convert € per square meter to $ per square foot, divide by 9.6), according to new data by Spain’s Ministry of Industry and Development. This pushed the national median price to its highest level since 2012, but it remains 22% below the crazy bubble peak:
Averaged out across the nation, across hot and cold housing markets, the current upswing in house prices has a ways to go before it comes even close to emulating the mind-watering dimensions of the last bubble. But in some markets, prices have been surging for four years, while in other markets, prices are now below where they’d been in Q1 2015, during the national low point. In these markets, prices have remained crushed (we’ll get to those in a moment). But the national median price throws all of them into the same bucket.
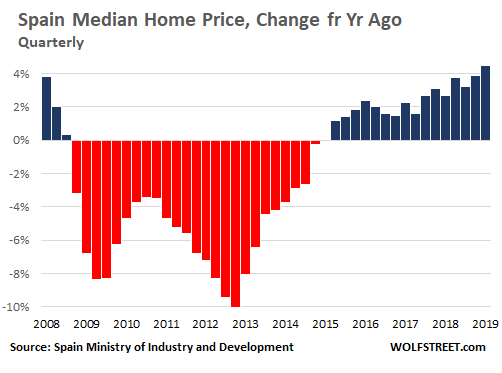
The first-quarter surge of the national median price was the biggest year-over-year gain since the first quarter of 2008 and the 16th year-over-year rise in a row. The year-over-year declines started in Q4 2008 and lasted through Q1 2015 — seven-and-a-half years of Housing Bust 1!
The current price resurgence pales compared to Housing Bubble 1. Between 1996 and 2003, the median price in Spain rose by 176% — meaning prices nearly tripled over the span of seven years. Since 2015, so over the last four years, the median price in Spain has risen 13.5%.
But real estate is local. And in some cities and regions, the boom has been reignited. The biggest year-over-year price gains occurred where prices are already heating up again:
- Madrid: +8.3%
- Seville: +8.1%
- Barcelona: +7.4%
- Navarre: +7.0%
- Balearic Islands: +5.1%
- Canary Islands: +5.0%
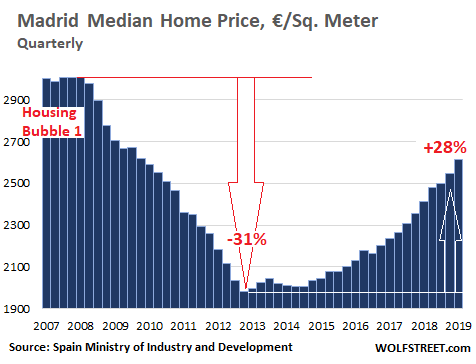
In Madrid, Spain’s largest real estate market, prices plunged 31% from the peak of Housing Bubble 1. From the trough in Q1 2015, they have now surged 28%, including the 8.3% year-over-year gain in Q1, to €2,613 per square meter, and at this pace are well on their way to Housing Bubble 2 — merely 12.9% below the crazy peak of 2008:
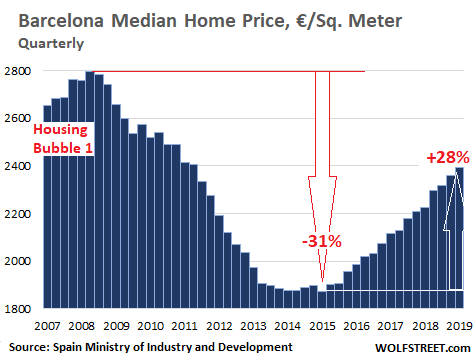
In Barcelona, Spain’s second largest housing market, home prices have tracked those of Madrid, but at a slightly lower level. The median home price plunged 31% from the peak of Housing Bubble 1 to the trough in Q1 2015. Then they surged 28%, including 8.3% year-over-year in Q1, to €2,392, also well on its way to Housing Bubble 2 — merely 14.5% below the crazy peak of 2008:
Aggregated home price data are somewhat in the eye of the beholder. The above quarterly data, released by the Spanish government, was dug up by WOLF STREET editor Don Quijones. He also dug up other data that show a similar trajectory of home prices, but on different scales, with much deeper plunges and much bigger surges.
For example, according to real estate appraiser Tinsa, house prices in Madrid plunged about 50% from around €4,000 per square meter at the peak in 2007 to around €2,000 at the low point in 2015. And by this measure, prices have since skyrocketed 62% to their current level of €3,240, which is about 19% below the crazy peak.
Something very similar has happened in Barcelona, where the median price plunged 50% from €4,400 per square meter in 2007 to $2,200 per square meter in 2015. Since then, the median price has surged 54% to €3,380 per square meter, according to Tinsa, but is still 23% below the 2015 peak.
Residential building activity is picking up for the first time since the crisis, with much of it focused on already heavily built-up coastal areas where demand for real estate, particularly among foreign investors, is strongest.
From Catalonia to the Balearic Islands, numerous building projects that fell through during Spain’s economic crisis have been restarted as growth returns. On the Costa Brava, a nearly 100-mile stretch of rugged coastline in northeastern Catalonia, some 20 projects are in the works, according to Don Quijones’ research, citing environmental group SOS Costa Brava.
The current mini-construction boom still pales compared to the boom before 2008, at the peak of which around 600,000 new homes were being finished each year. One year, the number reached a staggering 800,000, which meant that more homes were being built in Spain than in France, Germany and Italy combined, with an aggregate population four times greater than Spain’s.
Today, despite the best efforts of the last government to reanimate the construction and real estate sectors, including offering subsidies to first-time buyers and construction companies, fewer than 100,000 new homes are being built per year. Roughly 1.2 million people now work in Spain’s construction industry. While the number is growing, it’s still less than half as many as in 2008.
Does this mean that Spain is once again on the cusp of a high-octane housing bubble? The Bank of Spain and the Spanish government don’t appear to think so, arguing instead that real estate prices have merely reached a point of equilibrium. A few months ago, the IMF warned that although there is still no sign of a new bubble, there are indications of “a slight overvaluation” in the market.
While there may not be glaring signs of a national bubble, there are glaring signs in some markets, such as in Madrid, Barcelona, and some of the coastal and island markets.
But in other markets, home price have barely risen, and in in some markets, home prices are now below where they had been in Q1 2015, when the national low point occurred, according to the data by Spain’s Ministry of Industry and Development. And those markets remain crushed.
The table below shows all of Spain’s markets per the Ministry of Industry and Development: percentage change from the peak in Q1 2008 to the bottom in Q1, 2015; percentage change from the bottom in Q1 2015 to Q1 2019; and the median price in Q1 2019 in € per square meter. I highlighted the prices that are still below where they’d been during the national low point in Q1 2015:
| From Q1 2008 | From Q1 2015 | Price in € | |
| to Q1 2015 | to Q1 2019 | Q1 2019 | |
| Spain, aggregate | -30.6% | 12.2% | 1,636 |
| Andalucía | -32.9% | 7.9% | 1,304 |
| Almería | -35.9% | 3.7% | 1,117 |
| Cádiz | -31.6% | 3.5% | 1,354 |
| Córdoba | -25.9% | 0.5% | 1,155 |
| Granada | -30.0% | 5.1% | 1,120 |
| Huelva | -40.7% | 2.3% | 1,083 |
| Jaén | -27.3% | 0.1% | 810 |
| Málaga | -36.7% | 18.9% | 1,769 |
| Sevilla | -29.2% | 5.1% | 1,333 |
| 0 | |||
| Aragón | -39.3% | 1.3% | 1,206 |
| Huesca | -31.9% | -1.5% | 1,140 |
| Teruel | -22.9% | -3.2% | 784 |
| Zaragoza | -41.1% | 3.4% | 1,295 |
| Asturias (Principado de ) | -28.8% | 0.8% | 1,275 |
| Balears (Illes) | -22.1% | 23.8% | 2,321 |
| Canarias | -28.9% | 16.1% | 1,513 |
| Palmas (Las) | -28.6% | 17.8% | 1,608 |
| Santa Cruz de Tenerife | -28.9% | 14.3% | 1,418 |
| Cantabria | -27.7% | -1.1% | 1,456 |
| Castilla y León | -31.5% | 0.6% | 1,050 |
| Ávila | -43.2% | 2.1% | 841 |
| Burgos | -36.2% | -0.4% | 1,143 |
| León | -30.2% | 4.7% | 886 |
| Palencia | -20.4% | -4.8% | 1,002 |
| Salamanca | -25.0% | -4.2% | 1,173 |
| Segovia | -39.1% | -3.6% | 964 |
| Soria | -23.8% | -3.5% | 990 |
| Valladolid | -33.2% | 9.9% | 1,233 |
| Zamora | -30.9% | 2.9% | 865 |
| Castilla-La Mancha | -39.0% | 0.3% | 886 |
| Albacete | -28.6% | -3.8% | 923 |
| Ciudad Real | -29.3% | -3.4% | 753 |
| Cuenca | -27.5% | -0.9% | 776 |
| Guadalajara | -47.4% | 9.3% | 1,111 |
| Toledo | -45.8% | 2.5% | 832 |
| Cataluña | -32.7% | 22.0% | 2,019 |
| Barcelona | -32.1% | 27.6% | 2,392 |
| Girona | -34.9% | 7.8% | 1,533 |
| Lleida | -29.2% | 1.5% | 1,024 |
| Tarragona | -37.8% | 5.4% | 1,279 |
| Comunidad Valenciana | -33.4% | 9.2% | 1,226 |
| Alicante/Alacant | -30.1% | 7.9% | 1,312 |
| Castellón/Castelló | -40.7% | 6.5% | 1,088 |
| Valencia/València | -35.2% | 11.3% | 1,178 |
| Extremadura | -16.9% | -0.7% | 848 |
| Badajoz | -15.4% | -3.3% | 854 |
| Cáceres | -20.0% | 4.3% | 838 |
| Galicia | -25.7% | 2.0% | 1,190 |
| Coruña (A) | -25.3% | 3.7% | 1,224 |
| Lugo | -29.0% | 2.0% | 833 |
| Ourense | -15.6% | -0.4% | 957 |
| Pontevedra | -31.1% | 3.6% | 1,253 |
| Madrid (Comunidad de) | -32.0% | 27.8% | 2,613 |
| Murcia (Región de) | -39.3% | 2.3% | 1,003 |
| Navarra (Com. Foral de) | -25.4% | 8.4% | 1,417 |
| País Vasco | -20.8% | 0.0% | 2,406 |
| Araba/Alava | -22.7% | 2.8% | 1,993 |
| Gipuzkoa | -12.9% | 0.1% | 2,670 |
| Bizkaia | -23.5% | -0.6% | 2,367 |
| Rioja (La) | -33.4% | 3.0% | 1,129 |
| Ceuta y Melilla | -6.2% | 7.8% | 1,687 |
| Ceuta | -7.7% | 1.5% | 1,729 |
| Melilla | -1.5% | 12.1% | 1,688 |
Where are the foreign investors in this phenomenon that is playing out in the US? Read… US Home Sales Drop, Drop, Drop Despite Lower Mortgage Rates. But Mortgage Applications Jump. What Gives?