by Dana Lyons

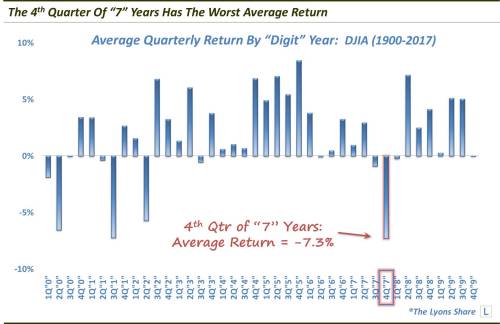
The 4th quarter of years ending in “7? have historically exhibited the stock market’s worst quarterly performance of the decadal cycle.
Exactly 3 months ago, we published a post highlighting what we discovered to be serially poor historical performance in the stock market during the 2nd half of years ending in a “7”. In fact, the period has historically exhibited the worst performance of any semi-annual period of the decadal cycle. Here’s what we wrote:
“Given our current year “2017”, we were recently pondering the unfortunate fate that has befallen the stock market during the most recent years ending in a “7”. There was the market top of 2007, the Asian crisis in 1997 and the crash of 1987. It got us wondering if this was just some recent fluke – or if there really was a sort of a curse around “7” years. So we got out our history books (i.e., we scrolled to the left on our chart of the Dow Jones Industrial Average) to check previous “7” years going back to 1900. As it turns out, 7 does indeed appear to be quite unlucky.
Consider the track record for the back half of “7? years:
- 2007: “Just” a 10% drawdown, but also a cyclical market top
- 1997: Asian Crisis…swift 17% drawdown
- 1987: “The Crash”…20% decline, with a 41% drawdown
- 1977: Cyclical bear market…9% decline, with a 15% drawdown
- 1967: Up 5% for half, but 12% drawdown, all in the 4th quarter
- 1957: Straight down from July…13% loss, with 20% drawdown
- 1947: Mostly unscathed…2% gain, with ”just” a 7% drawdown
- 1937: Major bear market…Down 29% with 41% drawdown
- 1927: Roaring bull…9% drawdown, but a gain of 21%
- 1917: Cyclical bear market…22% decline, with a 31% drawdown
- 1907: Cyclical bear market…24% decline, with a 35% drawdown
So, at first blush the track record looks pretty lousy. But is it any worse than most semi-annual periods? Yes.
At -9.29%, the 2nd half of “7? years has the worst median return of all half years. In fact, it is one of just 3 halves with negative median returns, along with the 1st half of “0? years and the 2nd half of “1? years. And other than the 1st half of year “0?, the median return of the 2nd half of year “7?’s is over 600 basis points worse than any other half year.
Looking at drawdowns, the picture is just as bad.
On average, the 2nd half of year “7? has experienced a drawdown of more than -20%, much worse than any other half year (FYI, the median drawdown in the 1st half of year “0? is worse than that of the 2nd half of year “7?, -19.51% vs. -16.83%).
Thus, when we were pondering the rough ride that stocks have suffered over the past several “7? years, its historical track record is actually even worse. Again, while we are not about to construct a trading system based on this data point, considering the overwhelming evidence, it does at least have our attention.
So, while the stock market remains in an uptrend, and hitting new highs in some cases, we do have an open mind that it may get “unlucky” at some point in the back half of this year.”
Well, halfway through this supposed “worst semi-annual” period, stocks are no worse for wear thus far. In fact, the market is in the midst of a historically broad-based, involatile and relentless rally. So perhaps the “7” curse has been sidestepped?
Not so fast.
As the 4th quarter gets under way (and just in time for Friday the 13th), we took a fresh look at performance in “7” years. What we discovered is that the lion’s share of the poor-performance during “7” year 2nd halves actually took place during the back half of those periods, i.e., the 4th quarter.
Specifically, of the -7.88% average historical return during the 2nd half of “7” years, a full 730 basis points, or -7.30%, of the loss took place in the 4th quarter alone. That ranks it as the worst average performance of any quarter of the decadal cycle.
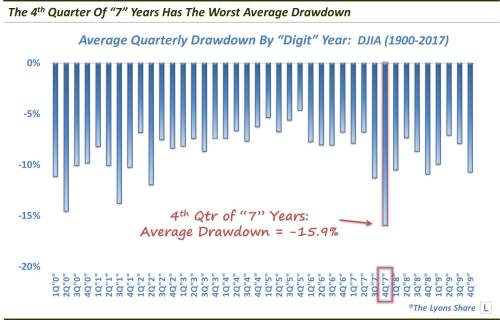
Further, of the -21.69% average historical drawdown during the 2nd half of “7” years, 15.93%, or nearly 1600 basis points, took place in the 4th quarter alone. Not surprisingly, that equates to the worst average drawdown of any quarter of the decadal cycle.
Is there a silver lining? One small one is the fact that due to a few out-sized losses, e.g., 1987 and 1937, historical median returns and drawdowns for the quarter are slightly less horrific. However, as the yearly rundown listed above can attest, the period has still exhibited consistently weak performance.
A more profound and perhaps relevant silver lining, though, is the present structure of the overall stock market. As mentioned in the opening, the recent rally has been broad-based and has delivered just about every major market average to all-time high ground. But will this combination of solid internals and price momentum be enough to stave off the “7” year, 4th quarter curse?
If you’re interested in the “all-access” version of our charts and research, we invite you to check out our new site, The Lyons Share. TLS is currently running a 30th anniversary 1987 Crash Commemoration SALE, offering a discount of 22.6% – the equivalent of the Dow’s 1-day drop on October 19, 1987. The SALE ends October 22 so considering the discounted cost and a potentially treacherous market climate forthcoming, there has never been a better time to reap the benefits of our risk-managed approach. Thanks for reading!