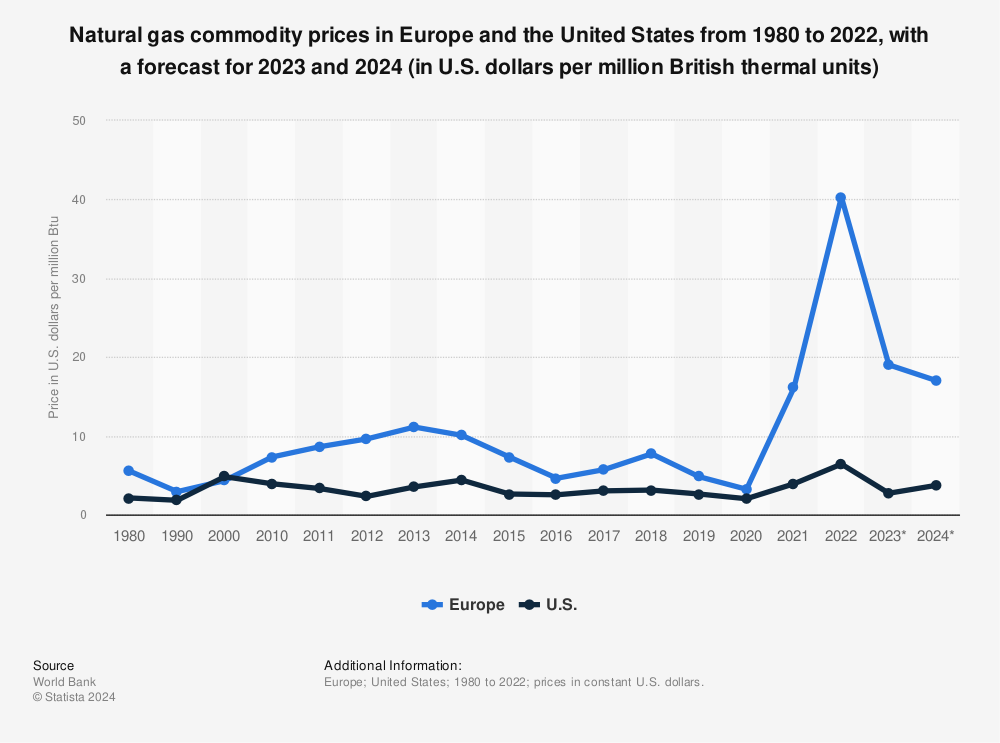
Chart compares price of nat gas in US with Europe

Sharing is Caring!

Statistic: Natural gas commodity prices in Europe and the United States from 1980 to 2021, with a forecast for 2022 (in U.S. dollars per million British thermal units) | Statista
Find more statistics at Statista
www.statista.com/statistics/252791/natural-gas-prices/

Trending:
See also  The NEW Banking Crisis In One Chart (Hint: Inflation = Fed Rate Hikes = Treasury/MBS Duration Increases = Bond Losses = Bank Runs) Bond Volatility Highest Since 2008
See also  Why Most Americans Cannot Afford a Home – A Price Breakdown

Views: 93

Leave a Comment

This site uses Akismet to reduce spam. Learn how your comment data is processed.