Wolf Richter wolfstreet.com, http://www.amazon.com/author/wolfrichter
Been reading misleading headlines about low inflation again? That is was “softer than expected” or whatever?
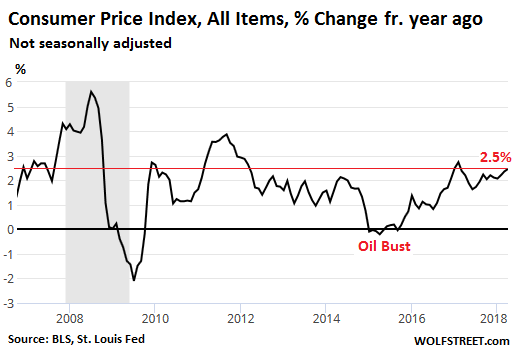
So here are the numbers: The Consumer Price Index (CPI) for April, which the Bureau of Labor Statistics released this morning, was 2.5% higher than a year ago. That increase may have been “lower than expected” – who’s doing the expecting? – but it was the fastest increase since February 2017. This chart shows the rising trend of inflation as measured by CPI:
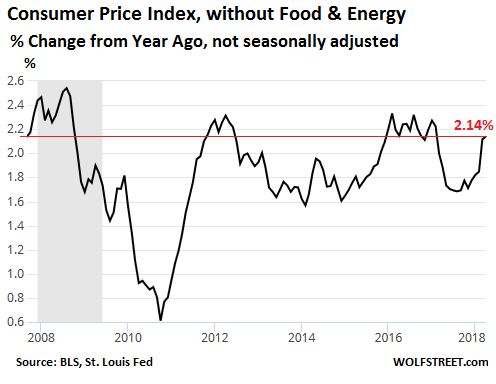
Core CPI, which strips out the volatile food and energy components, was up 2.14% compared to a year ago. This may also have been deemed by the headlines “lower than expected,” but it was the fastest increase since February 2017:
In the BLS press release near the top, which is where much of the media got hung up, it says this:
The indexes for household furnishings and operations, personal care, tobacco, medical care, and apparel all increased in April, while those for used cars and trucks, new vehicles, recreation, and airline fares all declined.
This refers to the seasonally adjusted changes from March to April. Monthly numbers are very volatile, and once they’re seasonally adjusted, they’re only as good as the seasonal adjustments. Making a headline out of seasonally adjusted month-to-month numbers can be misleading because headlines are all many people read.
For some perspective: Used vehicle CPI, which was one of the items mentioned by the BLS in the quote above, fell 0.4% in April from March not seasonally adjusted. The measure of used vehicle CPI is very volatile on a monthly basis. This chart shows the month-to-month percentage changes of used vehicle CPI not seasonally adjusted:
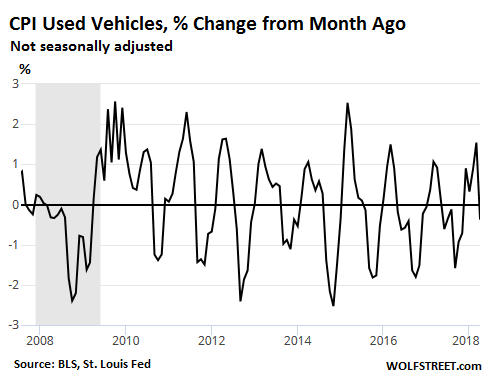
This chart illustrates that, in order to hammer this into a smooth line on a month-to-month basis, the index must be heavily seasonally adjusted – and what emerges at the other end is only as good as the seasonal adjustments.
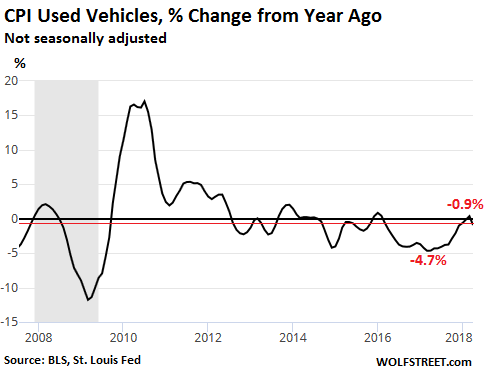
On a 12-months basis — not seasonally adjusted because there are no seasonal factors to worry about — the used vehicle CPI fell 0.9%, but that’s way up from year-over-year declines that were over -4.0% during the 12-month period between August 2016 and July 2017, and as steep as -4.7% in April 2017. So now, those price declines are disappearing, but given the volatility of the used vehicle CPI, they’re not disappearing smoothly, and there are going to be zigs and zags, and we just had one of the zags:
Two days ago, I wrote about the surging wholesale prices in used vehicles [What’s Going On in the Used Vehicle Market?]. I also pointed out that it takes a couple of months on average between the moment a vehicle is sold at auction to when it is retailed by a dealer to a customer. In some cases this may be a week, in other cases this may be several months. Then it takes some more time before the price-data gatherers at the BLS pick up on any price increases that the dealer, in negotiating the deals, was able to push through to the consumer.
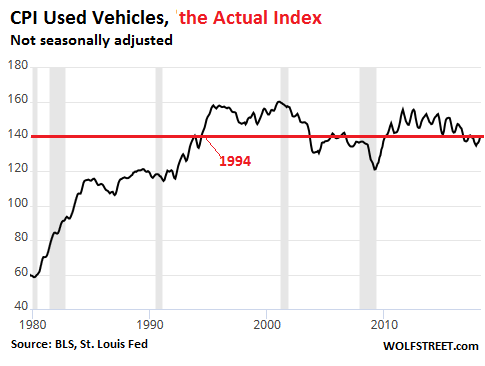
This number is then adjusted in the manner of all CPI data, including with “Hedonic Quality Adjustments” that will lower CPI data compared to actual price changes. These adjustments hit used vehicle CPI particularly hard, and this is why the used vehicle CPI — the actual index value — is at the same level it had been in 1994, confusingly for used-car buyers, given how much more expensive used vehicles have gotten over the past 24 years:
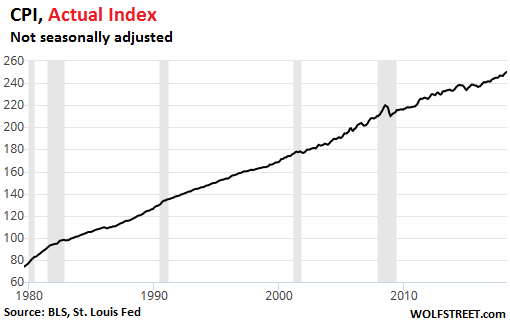
By comparison, below is the actual index for the overall CPI. While the used vehicle CPI is now at the same level as in 1994, the overall CPI, which includes the used vehicle CPI, is up 72% over the same 24-year period:
So I don’t expect the surge in used vehicle wholesale prices in April to show up in the CPI data until about two months later, at the earliest. Maybe June, but more likely July. And when it does show up, it will be in softened form as per hedonic quality adjustments and other adjustments.
There are similar inflation pressures building up in the pipeline that are only gradually seeping through, including surging transportation costs that many consumer-goods companies have been griping about and that I have coveredover the past few months.
And there is nothing in this CPI data that would encourage the Fed to slow down its “gradual” rate-hike machine. Meanwhile, the Fed’s QE unwind is ramping up, and the amounts are getting serious. Read… Fed’s QE Unwind Accelerates Sharply