Madrid area hospitals were forced into wartime-triage, denying care to the elderly in order to give the young a better chance.
By Wisdom Seeker, a WOLF STREET Commenter with a physical sciences Ph.D., San Francisco Bay Area:
This post takes a fresh look at key battlegrounds in the CoronaWar which we discussed last week. For local readers, I’ll take a unique and fresh look at the Bay Area, LA and California. Around the US and globally, Spain joins Italy’s misery, but New York continues to hold out! I share and discuss fresh graphs from a new website, 91-divoc.com by Professor Wade and his crew at U of Illinois.
The graph below all focus on confirmed cases per million population, based primarily on the Johns Hopkins University (JHU) ArcGIS COVID dataset from 3/27, representing cases confirmed mainly through 3/26. California and Bay Area county data were also taken from state and county websites.
These graphs use a log scale on the vertical axis, similar to stock charts. This type of plot turns exponential curves into straight lines, which makes it easier to look at the early behavior and also spot “bending the curve” effects of social distancing and other public health measures.
Two reminders: graphs of “confirmed cases” are subject to limitations and variations in testing. Depending on the level of testing, the actual spread of the disease could be 10-1000 times larger than the confirmed cases. There’s now a “COVID Tracking” website which allows one to dive into the testing details for individual U.S. states.
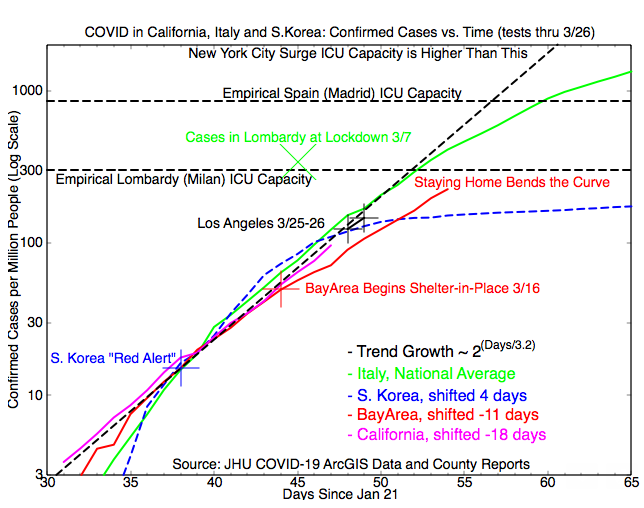
California Hot Spots Compared to Italy and South Korea:
Our first graph this week is an update for California and its two largest metro area hot spots, the San Francisco Bay Area and Los Angeles County. Italy and South Korea are included for contrast: Milan in Italy has been overwhelmed for the past 2-3 weeks and suffered a high death toll, while Korea successfully “bent the curve” so far with extensive test-trace-and-isolate techniques to reduce new infections.
Some good news: The Bay Area has continued to drop off the “Trend Growth” curve, and the effects of the March 16 “shelter in place” are expected to bend the curve further in the coming week, although accelerated testing is hopefully catching a larger share of the total cases. But the Bay Area has overrun the Korean example and appears to be on a curve similar to Italy’s, albeit lower.
By contrast, it looks like LA hasn’t begun to bend the curve yet. As the statewide shelter-in-place kicks in, hopefully that will change!
But, back on the positive side, the “Empirical Lombardy ICU Limit” has proved pessimistic, and I’ve added empirical data for Spain and New York to highlight the range of caseloads at which ICU capacity has held up. More about that below.
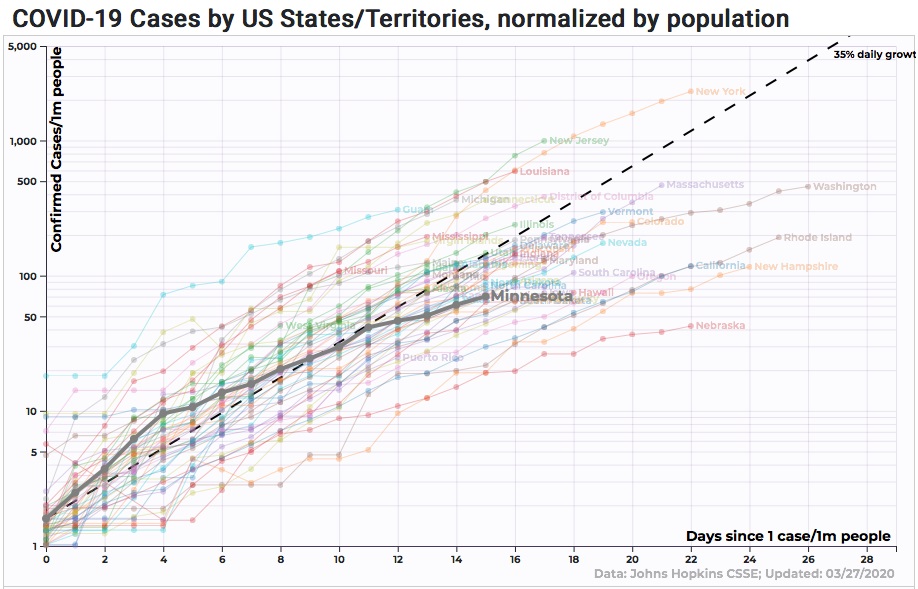
The 50 US States: New York Leads in Growth but Minnesota Bends It Best
Taking advantage of the new 91-DIVOC.com graphing tool, this week’s US State graph features Minnesota, which has exceptionally good testing and appears to be successfully “bending the curve”. Like last week’s plot and the California plot above, today’s graph shows confirmed cases per million population on a log scale. But now all 50 states are included. My one quibble is that the fixed “35% daily growth” trend line appears a bit too steep to my eye.
Among the 50 States, New York sadly holds the lead again this week, followed closely by sidekick New Jersey, and trailed by Louisiana. Louisiana earned my second “COVIDIOT Award” for not canceling Mardi Gras and thereby seeding the whole region with new cases.
New York’s “we don’t need no stinking shutdown” attitude earned them my first “COVIDIOT Award”, failing to account for super-spreading effect of close-quarters living with the nation’s highest population density.
But never underestimate the grit of New Yorkers! So far, they have done better than anywhere at boosting local medical capacity to withstand a huge caseload. New York’s lead, unfortunately, is not simply a matter of more testing: New York has a very high “hit rate,” 30% positive on their tests, indicating that they aren’t testing enough to corral all the cases. I expect New York to have ICU triage issues next week.
By contrast, Minnesota’s “hit rate” is far lower, with under 3% of tests being positive. That’s an order of magnitude lower than New York’s, and comparable to Korea’s. Minnesota also bought time with early school shutdowns, a week ahead the Bay Area relative to the local caseload.
With spread slowed, Minnesota has a chance at “testing out” all contacts of known cases. They might almost corral the virus, and should at least slow its growth substantially. Several other states have also been doing well at slowing the growth rate, but who will be the first to stop it? What does it take?
COVID in the 25 Most Populous Nations: There is Pain in Spain
Last week’s essay highlighted the “most infected” major nations: Italy, Spain, and the “ski nations” of Norway, Iceland, Switzerland and Austria. This week’s graph shifts emphasis to the 25 nations with the highest populations. The US, with the highest number of “acknowledged confirmed” cases, takes 6th place on this graph “per million people.”
Spain and Italy are at the top of the curve again. There is heartrending pain in Spain this week: Madrid area hospitals were forced into wartime-triage, denying care to the elderly in order to give the young a better chance. Wuhan, Iran, Milan, Madrid – who will be next? The next three contenders are Paris, New York, or a hot spot in Germany.
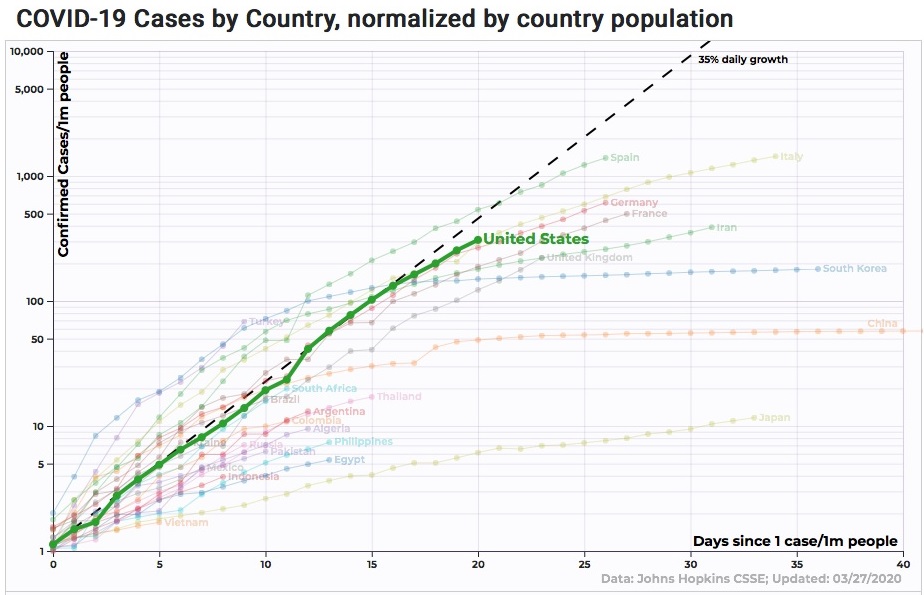
One last comment – nearly hidden on the left of the chart is the purple curve for Turkey, which has just overtaken China for 9th place. It’s good to see Turkey “catching up” in testing, but the data indicate a large underlying infection level. And amidst a pandemic, Turkey’s move this month to export 4 million refugees becomes a grave concern for the whole region.