Wolf Richter wolfstreet.com, http://www.amazon.com/author/wolfrichter
Prices in red-hot Dallas slow. Chicago condos flat for the year. Formerly crushed Detroit up 100% in 7 years. Cleveland struggles out of crushed status.
Yesterday, we did The Most Splendid Housing Bubbles in America — such as the San Francisco Bay Area, New York City metro, the Miami metro, Seattle, and other markets that have or had mind-bending house-price bubbles. Today, we do the other markets in the 20-city CoreLogic Case-Shiller Home Price Index – the cities where house prices have not yet doubled since 2000.
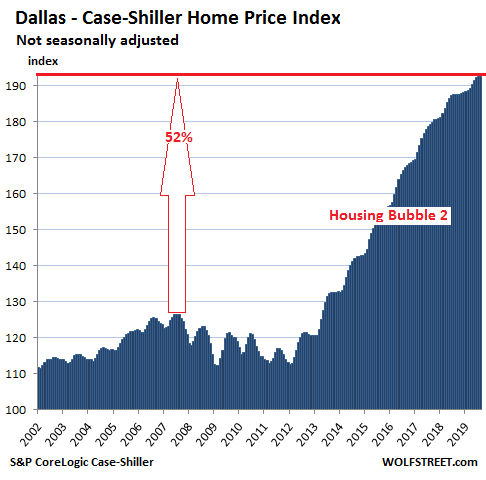
Dallas-Fort Worth House Prices:
In the Dallas-Fort Worth metro – the counties of Collin, Dallas, Delta, Denton, Ellis, Hunt, Johnson, Kaufman, Parker, Rockwall, Tarrant, and Wise – the blistering house price boom of the past seven years is slowing. In August, prices of single-family houses remained flat with July, and are up only 2.8% from August last year, according to the CoreLogic Case-Shiller Home Price Index. “Only 2.8%” because between the end of 2012 and mid-2018, year-over-year price increases ranged from 5% to over 10%; the first time since 2012 that year-over-year price increases dropped below 3% was in April 2019:

The Case-Shiller Index is a rolling three-month average. This release represents closings that were entered into public records in June, July, and August.
The charts here are on the same scale, with the vertical axis going from 100 to 195, to make price movements easier to compare from market to market. The exception is Detroit. We’ll get to that in a moment. As you go down the list of cities, house price increases are smaller and smaller, compared to Dallas; and so the white space above the curve increases.
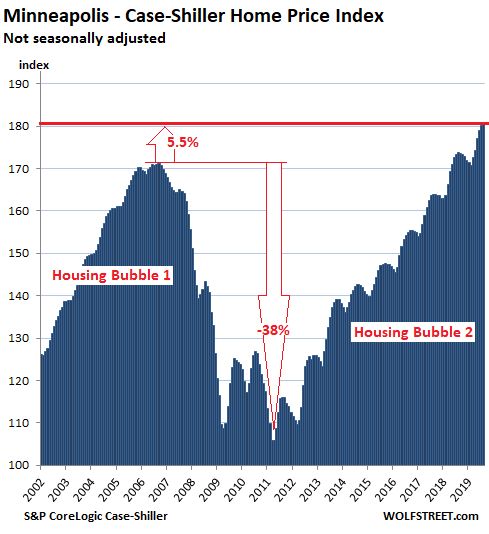
Minneapolis house prices:
House prices in the Minneapolis metro ticked up 0.2% in August from July, to a new record, for a year-over-year gain of 3.9%. The index now exceeds the peak of Housing Bubble 1 by 5.5%. Note the slightly larger white space above the peak of the curve, compared to Dallas:
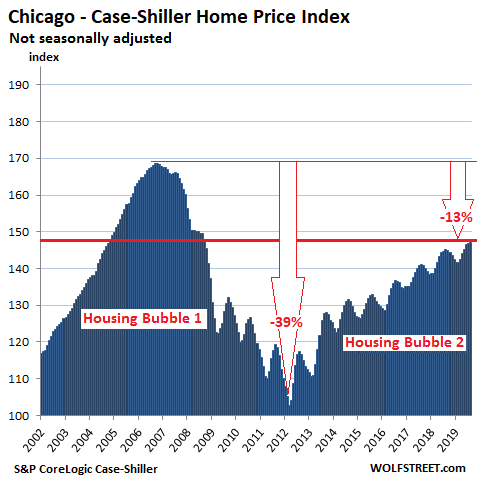
Chicago House Prices:
Prices of single-family houses in the Chicago metro ticked up 0.1% in August from July, which whittled down the gain compared to August last year to 1.6%. The CoreLogic Case-Shiller Home Price Index includes in the Chicago metro the counties of Cook (where the City of Chicago is), DeKalb, Du Page, Grundy, Kane, Kendal, McHenry, and Will. The index is still down nearly 13% from the crazy peak during Housing Bubble 1:
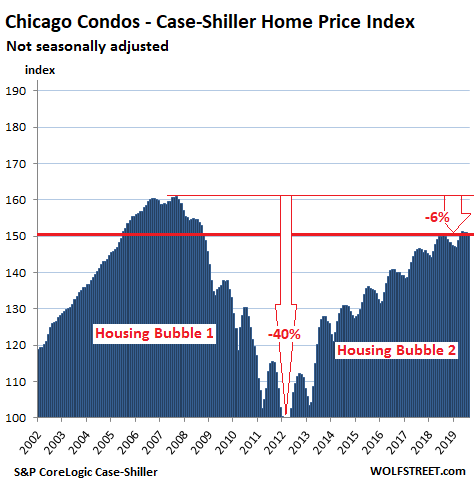
Chicago Condo Prices:
Condo prices declined 0.2% in August from July, the second month in a row of declines, after a flat reading in June, which whittled down the year-over-year gain to just 0.4%:
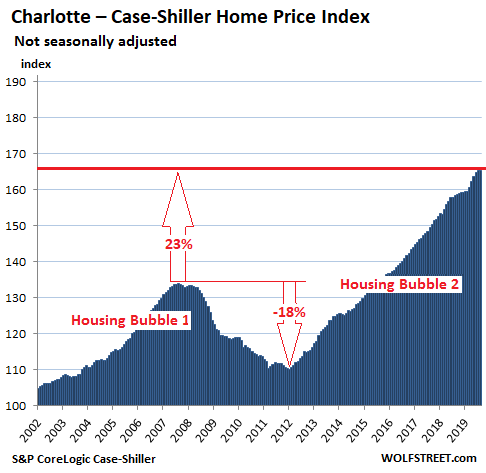
Charlotte house prices:
House prices in the Charlotte metro edged up 0.1% in August from July and were up 4.5% year-over-year, still progressing with its price boom that started in early 2012:
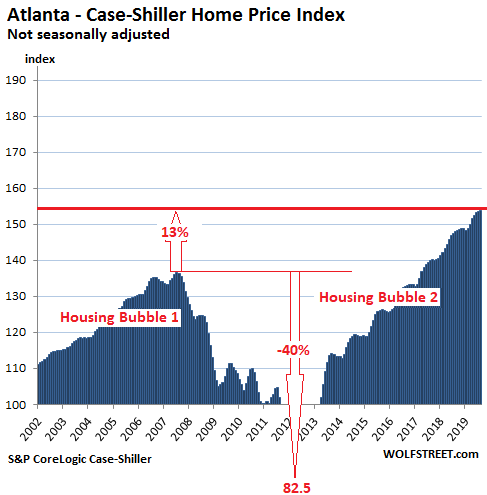
Atlanta house prices:
House prices in the Atlanta metro edged up 0.2% in August compared to July, leaving the year-over-year gain at 4.0%, the smallest such gain since September 2012, when Atlanta emerged from Housing Bust 1, during which the Case-Shiller index had plunged 40% and in early 2012, hit a value of 82.5, a level first seen in 1996:
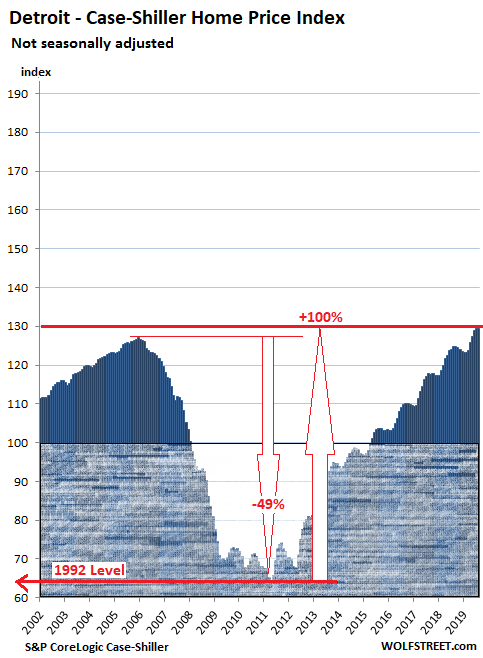
Detroit house prices:
House prices in the Detroit metro – the counties of Lapeer, Livingston, Macomb, Oakland, Saint Clair, and Wayne which includes the City of Detroit – inched up 0.1% in August from July and are up 3.8% year-over-year, hitting an all-time record for the fourth month in a row, surpassing by 1.9% the old high of December 2005.
To show how far prices plunged from already low-ish level during Housing Bust 1, and to what extent they have soared since hitting bottom – namely 100% – I have extended the scale down to start at 60 instead of 100. This additional part of the chart is marked by the shaded area:
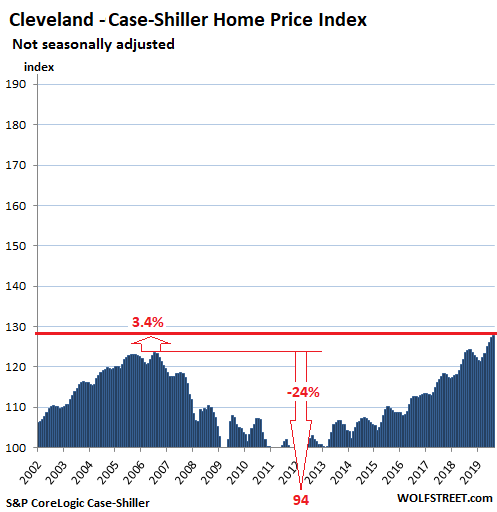
Cleveland house prices:
House prices in the Cleveland metro ticked up 0.3% in August from July and were up 2.9% year-over-year, setting a new record for the fourth month in a row, now up 3.4% from the old record of 2006:
Since January 2000, the Case-Shiller Index for Cleveland has risen 28%, the smallest such increase among the 20 metros covered by the Case-Shiller Index, and below Detroit’s gain of 29%. The record percentage-increases among the 20 metros in the Case-Shiller Index is held by the Miami metro, where prices skyrocketed 193% between January 2000 and December 2006, before collapsing. The record percentage-increase for the period from January 2000 through August 2019 is held by the Los Angeles metro, where prices surged by 186%.
Despite startup millionaires, house & condo prices in San Francisco Bay Area and condo prices in New York City fall from a year ago. Seattle is down again. Los Angeles, Las Vegas lose steam. Phoenix, others are running hot. Read… The Most Splendid Housing Bubbles in America, October Update