
To understand the Fed’s culpability for the inflationary disaster afflicting the American economy, it is necessary to start with the Big Lie that underlies all of its destructive machinations: the claim that market capitalism gravitates toward cyclical instability, recession and chronic shortfall from its potential Full Employment path.
From this presumption, there flows an alleged requirement for continuous central bank “stimulus.” Deft action by the central banking arm of the state is purportedly needed to compensate for the inherent prosperity-retarding imperfections of the free market.
If Fed policy has actually been reducing cyclical instability and pushing the $21 trillion US economy ever closer to its Full Employment potential, then productivity growth should be rising over time commensurate with the Fed’s more aggressive deployment of its “stimulus” policies.
In this context, it should be noted that productivity growth is a purer measure of monetary policy impact than total real GDP growth. That’s because the latter is in part driven by long-run demographics and the annual growth of the labor supply.
Productivity growth has exhibited an indisputable decline over the past 72 years, even as Fed policy has become dramatically and chronically more “stimulative.” For purposes of analysis, we have divided the 1947–2019 period, when productivity growth averaged 2.14% per annum for the entire period, into three sub-periods which roughly track the progressive ratcheting up of central bank stimulus policy.
During the first of these periods, the Fed was still tied to the Bretton Woods gold exchange standard and had modest room for stimulus, while during the second period it was just getting its money-printing sea legs and discovering how far it could actually go with a pure fiat dollar.
And the final stage commenced with the financial crisis of 2008, when the Fed embarked upon stimulus unbound. In this stage the balance sheet erupted from $0.9 trillion to $7.9 trillion during the 13 years after the pre-crisis peak.
Needless to say, Fed stimulus policy and US productivity growth are inversely correlated, and dramatically so.
Nonfarm Labor Productivity Growth per Annum decreased with each stage:
- Gold-anchored dollar era, 1947–1970: 71% per annum;
- Initial fiat dollar era, 1970–2007: 03% per annum;
- Unhinged fiat dollar era, 2007–2019:37% per annum;
You just plain can’t argue with the above statistical riff. Nor can the Fed heads and their apologists claim that long-term productivity growth is not an appropriate measure of their policy efficacy.
The Fed is peddling a growth and economic performance narrative that is wholly unwarranted.
It’s the Great Lie that obfuscates the fact that it’s really in the anti-prosperity, pro-inflation money-pumping business.
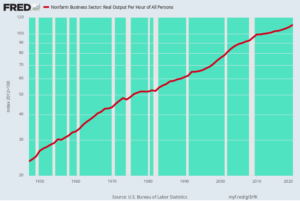
Annual Nonfarm Labor Productivity Growth, 1947–2020
Common sense and casual observation tell you that the Fed got steadily more aggressive in its stimulus policies during the unfolding of the three periods shown above.
The following illustrates the point well:
Fed Balance Sheet Growth/ Per Annum Money GDP Growth = Stimulus Ratio
- Gold anchored dollar era, 1947–1970: 6.6% GDP growth, 2.4% Fed balance sheet growth = 36% Stimulus Ratio;
- Initial fiat dollar era, 1970–2007: 7.3% GDP growth, 6.7% Fed balance sheet growth = 92% Stimulus Ratio;
- Unhinged fiat dollar era, 2007–2019: 3.1% GDP growth, 12.3% Fed balance sheet growth = 400% Stimulus Ratio
The above omits the 2020 data owing to the massive disruption of both the GDP numbers and the monetary statistics caused by the COVID-Lockdowns and the radical fiscal and monetary experiments implemented to counter them. In fact, the Fed’s balance sheet soared skyward by $3 trillion, even as money GDP fell backward resulting in a 13-year trend that was even more over the top:
- Unhinged fiat dollar era, 2007–2020: 2.9% GDP growth, 17.1% Fed balance sheet growth = 590% Stimulus Ratio.
At the end of the day, the only real policy “tool” the Fed possesses is its printing press. Namely, it cannot really move interest rates lower, implement QE, ease financial conditions on Wall Street or accommodate better economic performance on Main Street (to use its preferred nomenclature) except by expanding its balance sheet.
Accordingly, the ratio of Fed balance sheet growth to money (nominal) GDP growth is a close quantitative proxy for its level of “stimulus.” And on that measure, the results are the opposite of the deteriorating productivity trend shown for the three periods above.
Stimulus has gone parabolic.
How did productivity grow by 2.71% per annum over 1947–1970 — double the 2007–2019 rate — when the Fed’s balance sheet grew by a mere 2.4% per annum or just 38% of the growth rate of nominal GDP?
The truth is, we are dealing with narrative, not facts or analytics.
The Fed’s absurd money-pumping is so convenient for both Wall Street speculators and money-movers and Washington’s debt-addicted politicians that no one questions the narrative. No one points out that the emperor of improved economic growth and performance is buck naked.
Editor’s Note: The Fed has already pumped enormous distortions into the economy and inflated an “everything bubble.” The next round of money printing is likely to bring the situation to a breaking point.
If you want to navigate the complicated economic and political situation that is unfolding, then you need to see this newly released video from Doug Casey and his team.
In it, Doug reveals what you need to know, and how these dangerous times could impact your wealth.