via UPFINA:
After the amazing growth in the control group in the June and July retail sales reports, we were wondering if the strength would continue in August especially since the University of Michigan consumer sentiment report was negative due to the worries about tariffs. The latest round of tariffs that’s heavily weighted towards consumer goods didn’t go into effect until September to be clear. The August retail sales report ended up being very strong because of motor vehicle and parts sales and online sales. The breadth of the report was weak, but we can’t call it a problem if spending shifted to online sales and the total was solid.
Another Great Retail Sales Report
Specifically, monthly headline retail sales growth was 0.4% which doubled estimates and was on top of a positively revised July reading which improved 0.1% to 0.8%. Positive revisions make it tougher to beat monthly growth estimates, but this report did so anyway. Retail sales growth excluding autos was 0% which fell from 1% and missed estimates for 0.2%. It was weak because this report was driven by motor vehicle and parts sales. Excluding autos and gas had sales growth of 0.1% which fell from 0.9% and missed estimates by 0.2%. Finally, the all-important control group had monthly sales growth of 0.3% which met estimates and fell from 1%.
This great retail sales report signals the consumer isn’t pulling back because of tariff worries. It is buying more items because real wage growth is strong. Consumption will drive real GDP growth like it did in Q2. As you can see from the chart below, yearly retail sales growth improved from 3.6% to 4.1% making it the strongest growth since October.
US Retail Sales hit a new high, up 4.1% in the past year. pic.twitter.com/Ohxzxbb96x
— Charlie Bilello (@charliebilello) September 13, 2019
That’s up from 1.4% in December which was hurt by the government shutdown and stock market volatility. When that report came out, some didn’t think the numbers were real. They were real, but it was just a temporary move lower. Speaking of real, inflation adjusted sales growth improved even more than nominal growth. Real yearly growth was 2.3% which improved 0.6%. This was the best reading since August 2018.
The control group measures retail sales excluding food services, car dealers, building materials stores, and gasoline stores. This reading goes directly into the GDP report. Monthly growth fell because of a tough comp, but yearly growth improved from 4.94% to 5.3% which is the strongest reading since May 2018 which had growth of 6.01%.
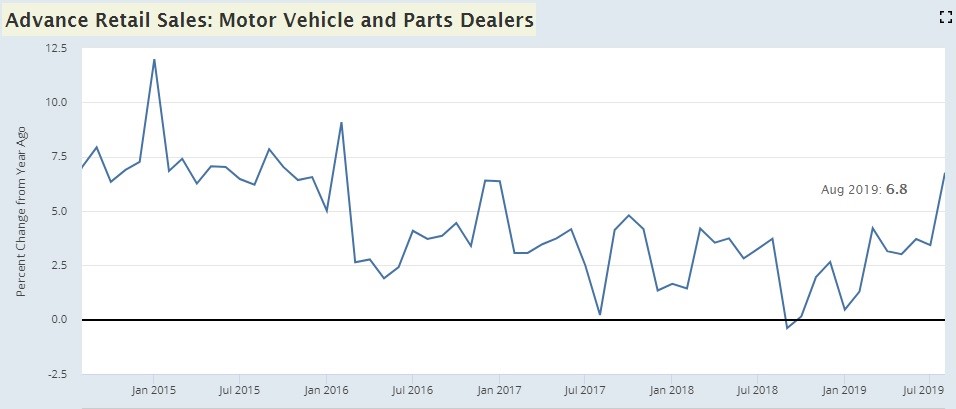
Let’s look at the two stars of the report. Motor vehicle and parts sales growth was 1.75% monthly. Yearly growth improved from 3.73% to 6.76% which is the best growth since February 2016. So much for the worries about the auto sector because of rising auto loan delinquencies. This isn’t in tune with the Markit report which stated the auto industry drove weakness in the manufacturing sector. Monthly retail sales growth was 0.36% and the motor vehicle and parts category drove 0.35% of growth. It has a 20.18% weighting in the report.
Online monthly sales growth was 1.6%. Yearly growth improved from 14.77% to 16.03%. This is back to back reports where yearly online sales growth has been the highest since December 2000 when the internet was in its infancy. If you divide non-store sales by total sales, online had a 6% weighting back then and has a 12.8% weighting now. The online category drove monthly retail sales growth 0.21% higher. That means the two star categories drove well over 100% of sales growth. That explains how 7 of the 13 major categories had negative monthly sales growth.
Restaurant Sales Growth Isn’t A Leading Indicator
This retail sales report had bad breadth. Most categories decline monthly. One of the most prominent ones to show weakness was food services and drinking which had -1.23% monthly growth.
As you can see from the chart below, yearly restaurant sales growth fell from 3.33% to 1.1%. That’s the weakest growth rate since February 2010 when the economy was just exiting the last recession.
US retail: smallest number of categories rising m/m since Feb and amongst these possible price distortions in motor vehicles and heathcare. Eating drinking retail sales y/y at 1.1%, weakest since 2010. There's a lot going on under the hood. pic.twitter.com/wQLyATPgCQ
— econhedge (@econhedge) September 13, 2019
It’s a misnomer that restaurant sales growth leads the economy. In November 2007, which was the month before the last recession, restaurant sales growth was a strong 5%. Restaurant sales growth was just 1.7% in January 2014 even though 2014 was a strong year for the economy. In February 2001, which was the month before the 2001 recession, restaurant sales growth was 4.7%. To be clear, weakness in restaurant sales growth isn’t good. It just isn’t a leading indicator for more weakness.
University Of Michigan Survey Rebounds Slightly
The University of Michigan index is in the doghouse in terms of indicators because it cratered in August, but the retail sales report was great as we just reviewed. This index is correlated with financial markets which were stressed in August. Some thought consumers would pull back on spending because of the tariffs. That didn’t happen.
As you can see from the chart below, the overall index improved slightly from 89.8 to 92 in September which beat estimates for 91.
Consumer confidence/Rates —> Read More: https://t.co/INInXnrpWJ pic.twitter.com/6vbMKqI3u5
— Peter Boockvar (@pboockvar) September 13, 2019
This preliminary report showed current conditions improved from 105.3 to 106.9 and expectations improved from 79.9 to 82.4. The net percentage of consumers expecting a decline in interest rates was the highest since February 2009. They are probably correct because the Fed should cut rates on Wednesday. 38% of consumers made spontaneous negative mentions of tariffs which was the highest since March 2018. These negative mentions haven’t implied weak retail sales, so maybe this data point should be ignored.
The Streak Ends
As you can see from the chart below, the TLT, which measures the long bond, ended its record long streak of 100 days above its 50 day moving average.
The 20+ year Treasury ETF $TLT is breaking a streak of 100 trading days above its 50-DMA today, its longest streak since it began trading in the early 2000s. https://t.co/H4p1RcpfIn pic.twitter.com/KoxPEf3mUA
— Bespoke (@bespokeinvest) September 13, 2019
For those surprised by the selloff in treasuries, recognize that when everyone is in on a trade and it reverses, the movement is sharp. This is like a dam breaking.
Conclusion
The retail sales report was amazing. The consumer is in solid shape. This report is partially why Oxford Economics is calling for 3.3% real PCE growth (the estimate was revised 0.2% higher). However, don’t get too optimistic because estimates for Q3 GDP growth are very low. The median estimate is for 2% growth. The Atlanta Fed Nowcast is at 1.8%, the NY Fed Nowcast is at 1.59%, and the St. Louis Fed Nowcast is at 2.65%.