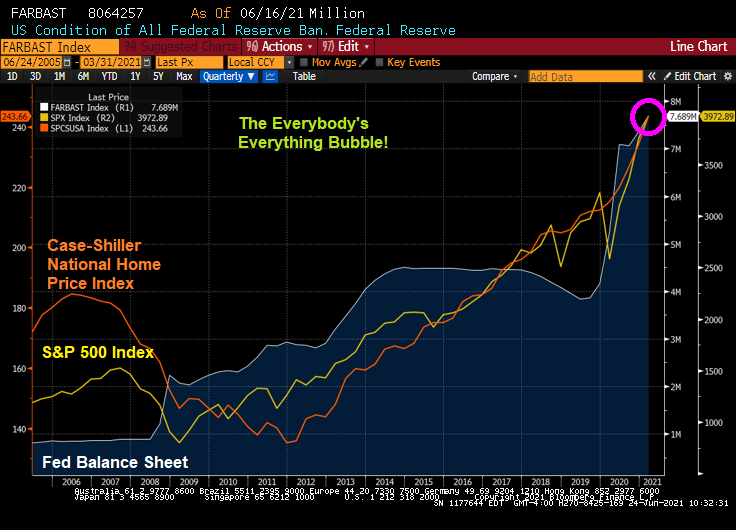
I call this the Everybody’s Everything asset bubble.
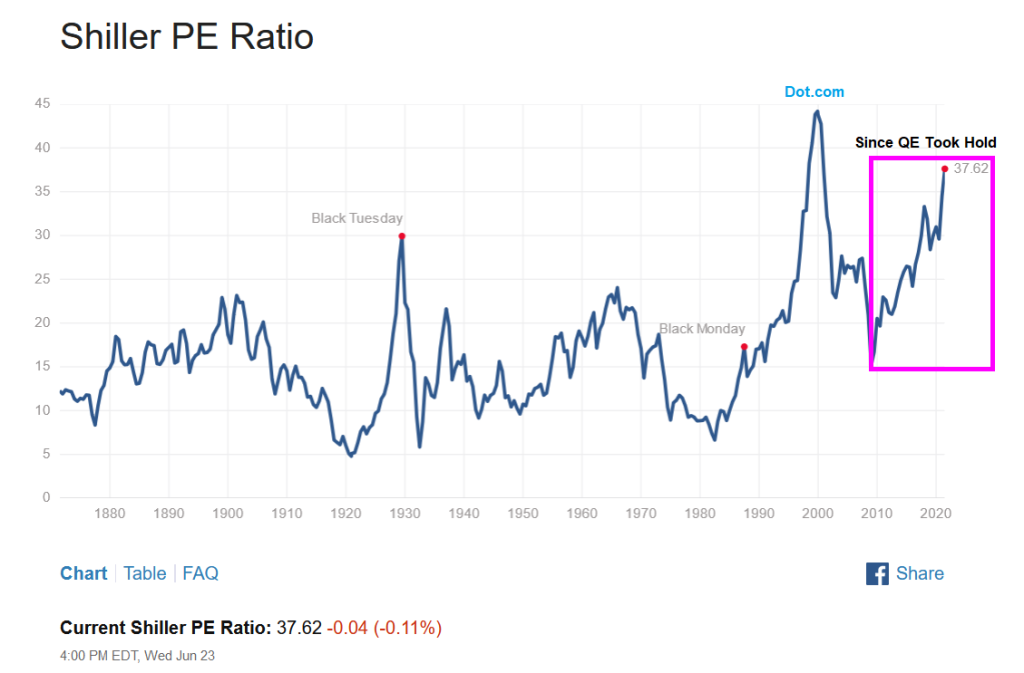
Take a look at Robert Shiller’s CAPE (Cyclically-adjusted Price-Earnings) ratio. It has been rising ever since The Federal Reserve and other global central banks began their interest rate suppression and quantitative easing (QE) programs. Not quite to the peak of the Dot.com bubble, but trying!!!
Since the housing bubble in the USA and subsequent financial crisis, central bank primary rates have fallen to zero … or below in the case of Japan (My Kuroda!).

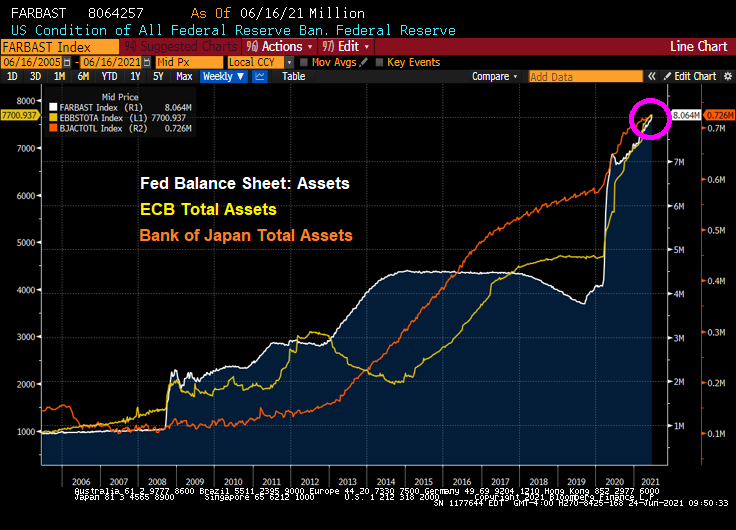
And central bank balance sheets remain swollen with only The Fed taking a brief pause in asset purchases only to be increased again to ludicrous levels.
The S&P 500 index and Case-Shiller National home price index are off the charts with Federal stimulus.
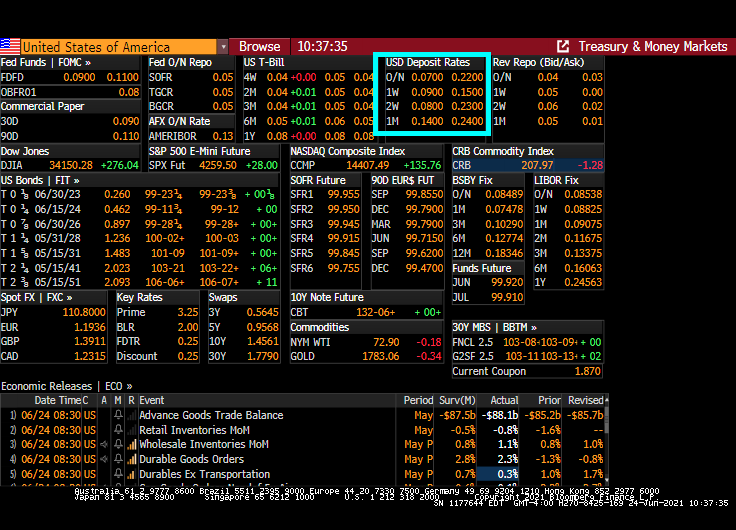
With The Fed’s continued interest rate suppression comes ultra-low deposit rates.
Speaking of out-of -control asset prices, here is a CBS report “Wrong direction”: Homes are now unaffordable in 4 of 10 U.S. counties.”
10 least affordable counties in U.S.
- Kings County (Brooklyn), New York, 100.8% of annualized weekly wages needed to buy a home
- Marin County, California (outside San Francisco), 81.4%
- Santa Cruz County, California, 76.2%
- Queens County, New York, 68.7%
- Monterey County, California (outside San Francisco), 65.9%
- Nassau County, New York, 63%
- San Luis Obispo County, California, 62.4%
- Sumner County, Tennessee, 62.1%
- Orange County, California, 59.2%
- Napa County, California, 59.1%
Notice that only one county in the 10 less affordable counties is out side of New York and California. That Sumner County, TN just outside of Nashville.