by Dismal-Jellyfish
Source: https://www.federalreserve.gov/newsevents/speech/jefferson20230227a.htm
Thank you, Jason, for inviting me to join your economics class and for your kind introduction. It is a pleasure to be here. I miss teaching economics classes.
Before I continue, I would like to note, as I always do, that the views I will express today are my own and are not necessarily those of my colleagues at the Board of Governors of the Federal Reserve System or the Federal Open Market Committee (the FOMC).
What I like about economics is that it deals with real-world issues, and many times we experience firsthand a topic discussed in textbooks. Take the recent inflation, for example. This may be your first experience with high inflation. I am sure you noticed prices going up at restaurants, supermarkets, and the gas pump without having to read about it in the newspaper. I, for one, can confirm that the inflationary pressure in the rental housing market in the Washington, D.C., area is real. While we have all experienced prices going up, it’s challenging to measure inflation itself and its consequences.
Today, I want to do the following: discuss with you different ways to measure inflation, characterize our recent inflation, and contextualize the battle against inflation in terms of the Fed’s dual-mandate goals of price stability and maximum employment. Then, I will offer some concluding remarks.
Different Ways to Measure Inflation
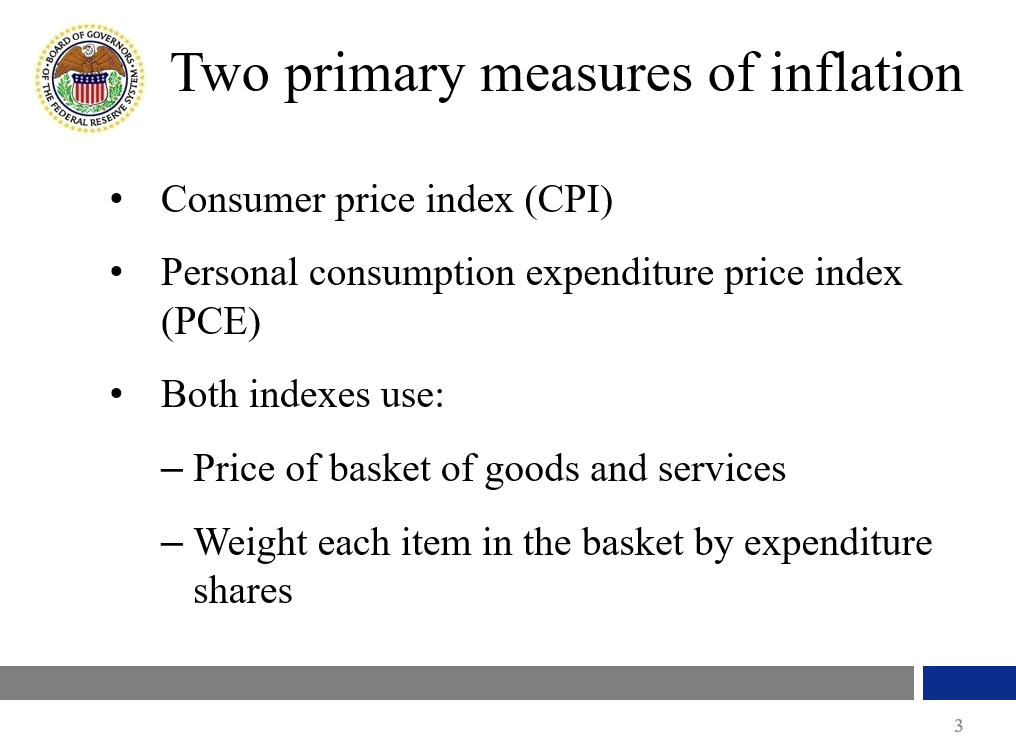
The two primary measures of the price level in the United States are the consumer price index, commonly referred to as the CPI, and the personal consumption expenditures price index, commonly referred to as the PCE price index. Positive changes in these indexes are recorded as inflation. Each inflation measure has both total (or headline) and core subindexes, which I will talk about later. The CPI and PCE price indexes are constructed in broadly similar ways, but there are important differences between them.1 Both indexes measure inflation using a specific basket of goods and services consumed by households. These baskets are similar but not identical across the two measures. Both measures also weight each item in their basket roughly in accordance with its expenditure share. That is, the more households spend on an item, like rent, the higher the weight it receives in the overall index. The weights are broadly similar across the two indexes, but, again, there are some important differences.
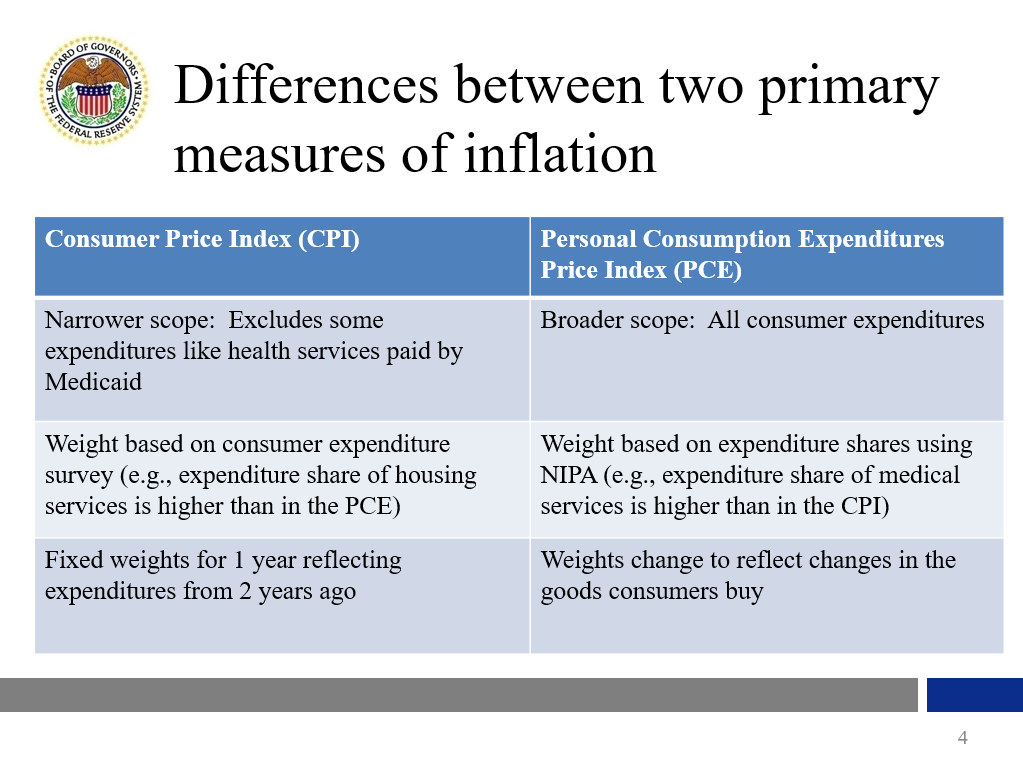
Now, let’s talk in more detail about the differences between the CPI and the PCE price indexes. First, the PCE price index has a broader scope than the CPI. The CPI is limited to expenditures that households pay out of pocket, while the PCE price index covers a broader set of goods and services as it seeks to cover prices for all consumer expenditures in the national income and product accounts (NIPA). For example, the PCE price index includes prices of the health services provided to households through Medicaid, while the CPI excludes these items.
Second, the PCE price index and the CPI use different weighting systems. The PCE price index, which is more comprehensive than the CPI, estimates expenditure shares using the national income and product accounts, while the CPI measures expenditure shares using a separate survey of households, the Consumer Expenditure Survey. This leads to some differences in expenditure weights that can at times be important. For example, the share of medical services is notably higher in the PCE price index (partly because the PCE price index includes more kinds of medical expenditures), and the share of housing services is noticeably smaller (because overall expenditures are larger in the PCE price index). As a result, when health-care services or housing services inflation behave differently than other prices, this can lead to differences in PCE versus CPI inflation.
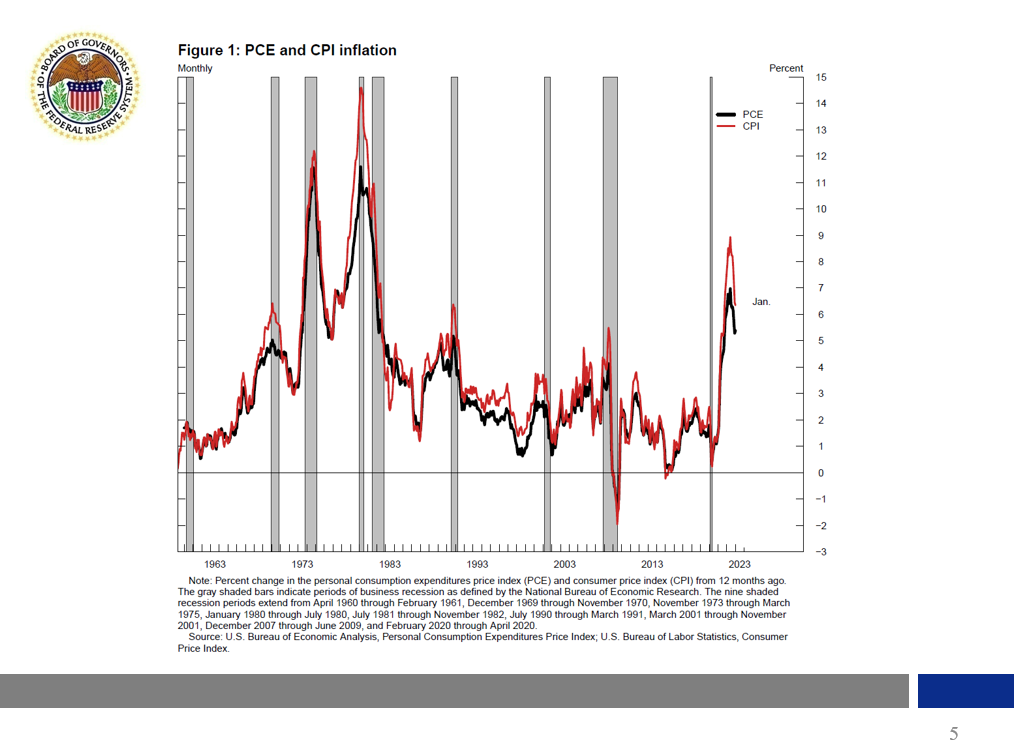
Another difference in the weights is that the PCE price index uses time-varying weights, while the official CPI keeps weights fixed for a year. The PCE price index weights change to reflect changes in the goods consumers buy. For instance, at the start of the pandemic, the CPI was still giving the same weights to cruise ship and airline fares, even though no one was traveling. The time-varying weights in PCE also account for substitution behavior. Suppose the price of apples goes up and the price of oranges stays the same. Consumers are then likely to substitute apples with oranges. In contrast, the CPI does not capture substitution behavior because the basket of goods consumers purchase is updated only once a year (instead of every month) and reflects expenditure patterns prevailing two years ago. The substitution effects captured by the PCE price index is one reason why PCE inflation (black line) is, almost always, lower than CPI inflation (red line), as you can see in figure 1.
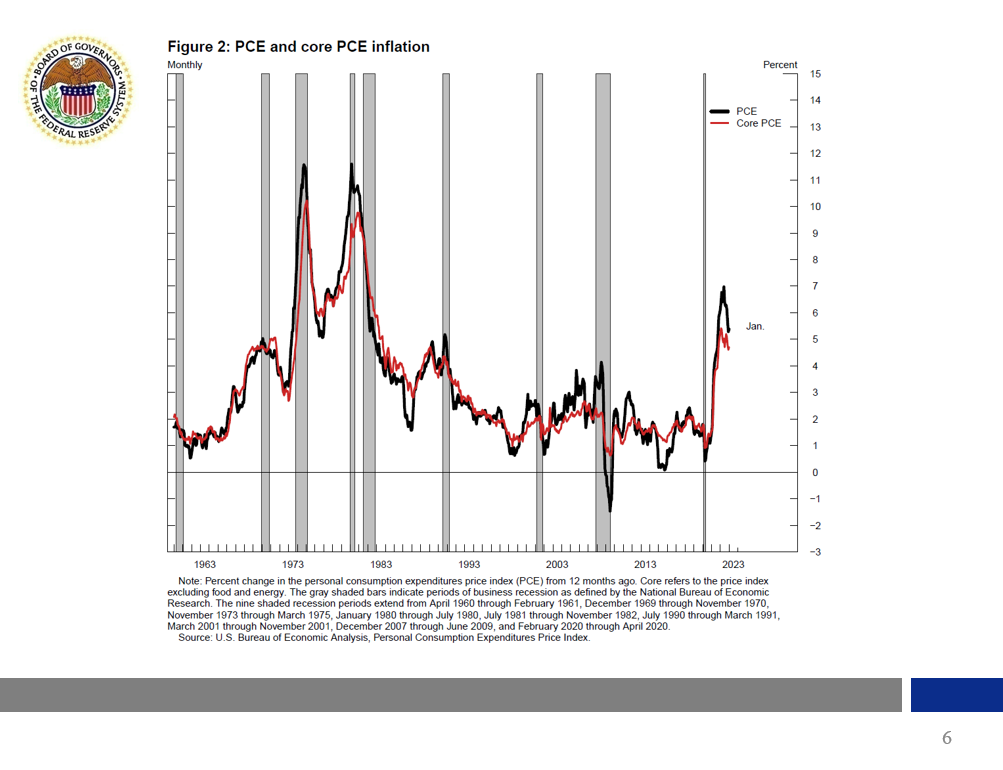
As I mentioned earlier, there are both total and core PCE price and CPI indexes. The core subindex is the total index excluding food and energy prices.2 Food and energy prices are more volatile than other prices, which makes total inflation more volatile.
This volatility is evident in figure 2. You can see the black line (total PCE price index) exhibiting more drastic ups and downs than core PCE price index, the red line in the graph, and many of the sharp movements are short lived. In other words, the volatility in the total PCE price index makes it harder to discern trends (longer-lasting movements) from transitory movements. In addition, food and energy prices often depend on factors that are beyond the influence of monetary policy, such as geopolitical developments (for example, those associated with fluctuations in energy prices) or weather or disease or war (for example, in the case of food prices).
In summary, the differences between CPI and PCE price indexes are important. The FOMC has chosen to target the PCE price index because it is broader and it captures more accurately what households are actually consuming.3 In addition, food and energy account for a significant portion of household budgets, so the Federal Reserve’s inflation objective is defined in terms of the total PCE price index, but the Fed monitors the core PCE price index, as well as other inflation indicators, in order to identify evolving inflation trends.4
Select Components of Core PCE Inflation
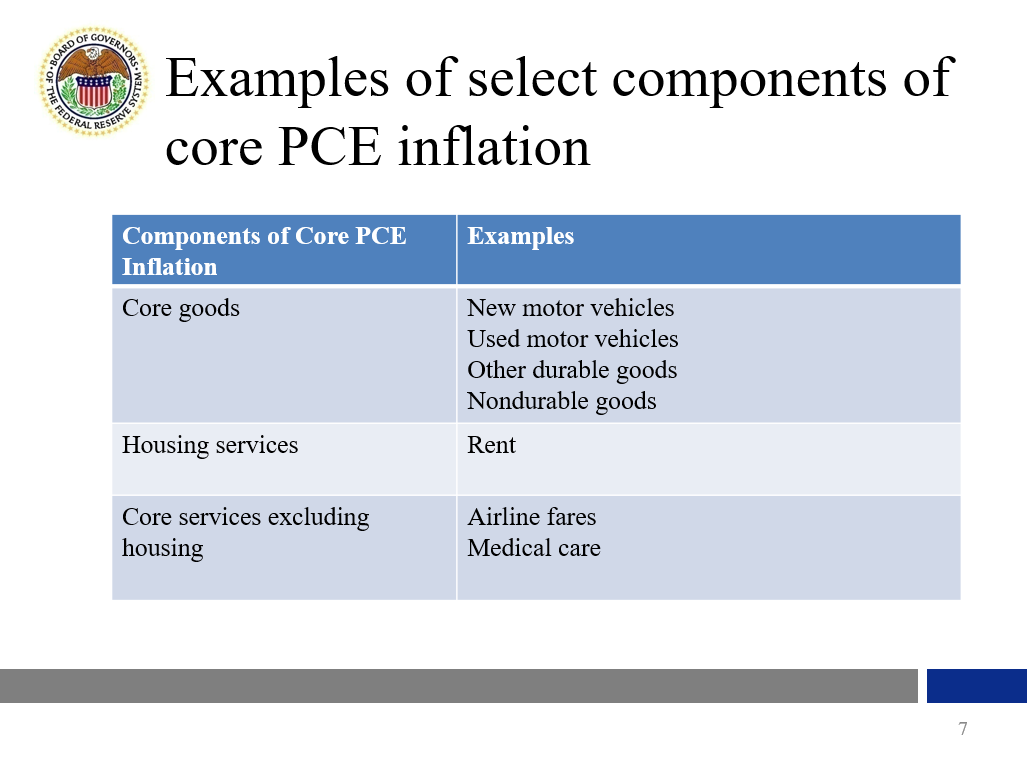
Now, I would like to dig a bit deeper into recent inflation trends. To do so, I find it useful to look at three large categories that together make up the core PCE price index: goods excluding food and energy, housing services, and services excluding housing and energy. Slide 7 provides some examples of what is in each subcomponent.
Slide 7: examples of select components of core PE inflation
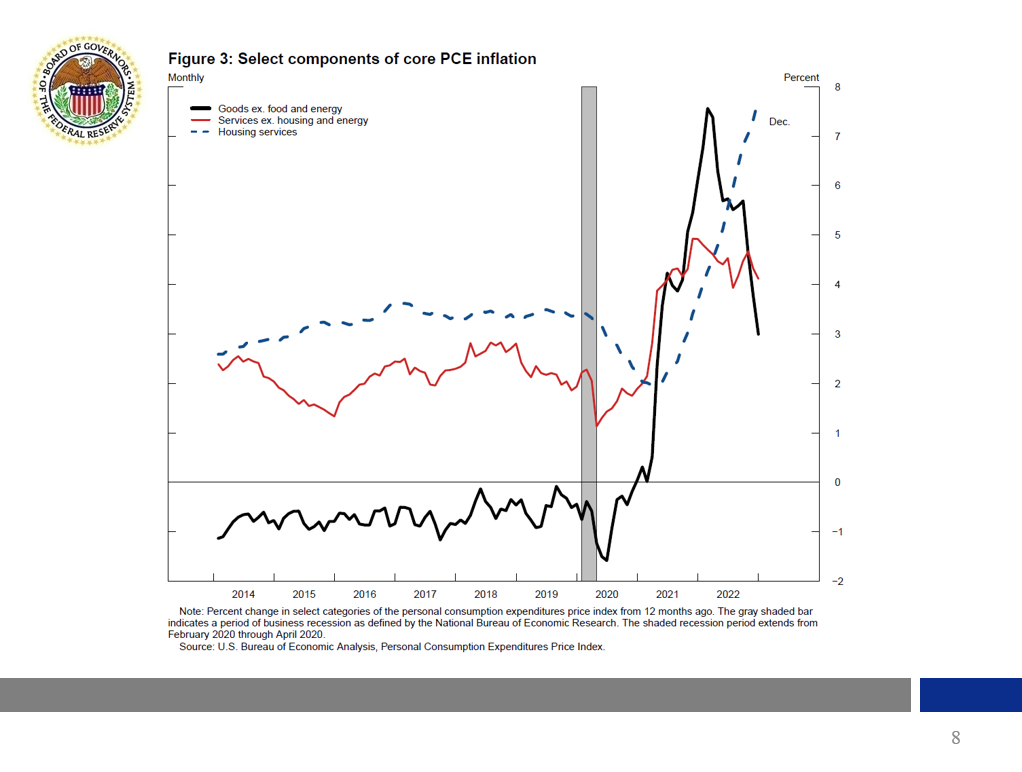
Figure 3 shows recent inflation rates for each component: goods excluding food and energy (black line), housing services (blue line), and services excluding housing and energy (red line). I look at these three categories separately because what has been causing inflation in each of these sectors is somewhat different. Understanding the different causes and how they affect the different components could help the FOMC predict the future course of inflation. Since monetary policy affects the economy (and inflation) with a lag, the Committee is always forward looking.
…