Wolf Richter wolfstreet.com, http://www.amazon.com/author/wolfrichter
The two-year yield, now surging, is a leading indicator.
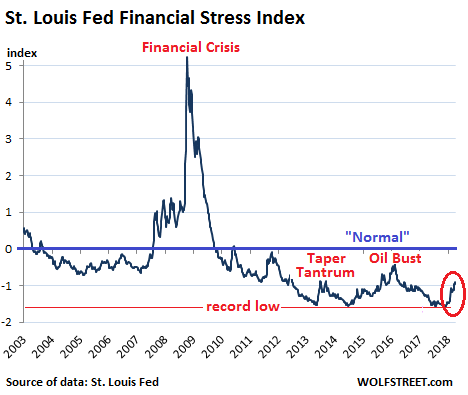
The Financial Stress Index, released weekly by the St. Louis Fed, is designed to track financial conditions that companies face in the markets. It reached record lows in November – meaning that there was extraordinarily little “financial stress” in the markets after years of ultra-easy monetary policies. The index then ticked up a little and did a mini-spike in February, but was still far below the historical “normal.” Then it zigzagged higher. Last week it had risen to the highest level since the Oil Bust two years ago, though it remained way below historical “normal.” In the current release, the index backed off again.
The index is designed to show a level of zero for “normal” financial conditions (blue line). When financial conditions are tighter than normal, the index shows a positive value. When these conditions are easier than normal, the index is negative. Note the recent rise (circled):
After years of ultra-loose monetary policies, financial conditions in the US economy have been dominated by risk-blind investors chasing any kind of yield, which resulted in minuscule risk premiums for investors, ultra-low borrowing costs even for junk-rated companies, and immensely inflated asset prices.
Even the Oil Bust and the Taper Tantrum, while they increased financial stress somewhat, couldn’t push financial conditions back to “normal” levels, given the Fed’s stimulus at the time. The chart also shows just how long the easy-money conditions have endured since the Financial Crisis, with the Financial Stress Index below “normal” since late 2009.
So now there’s also some response in the market to the removal of accommodation by the Fed, but it isn’t much. The response hasn’t even reached the level of the Taper Tantrum, when the Fed had suggested it might eventually “taper” away what had been called “QE Infinity.” Now at -0.97, the index remains solidly below “normal.”
The index, made up of 18 components – seven interest rate measures, six yield spreads, and five other indices – takes a broad measure of how markets perceive and price risk. And currently, the markets are still somnolent.
By “normalizing” its monetary policies, the Fed effectively attempts to tighten financial conditions in the markets to bring them back to historical norms: raise yields, widen spreads, increase risk premiums, etc. – in other words, make credit more expensive and harder to come by, and increase the price of risk.
But the market is slow to react to a shift in monetary policies. And when it does begins to react, the adjustments can be eye-popping.
The Financial Stress Index and the two-year Treasury yield move roughly in parallel, but with a large time lag. The two-year yield is very responsive to changes in monetary policy and tends to overshoot late in the rate-hike cycle. This makes it a leading indicator by years as to where many of the financial stress components will go: junk bond yields, spreads, risk premiums, and the like. They will follow – but way behind.
The two year yield (black line, right scale) started rising ever so slowly in 2014, as QE was ending. But in late 2016, it surged and hasn’t looked back since. The Financial Stress Index (red line, left scale) began rising just four months ago. The chart below shows this relationship. Look at the years leading up to the Financial Crisis:
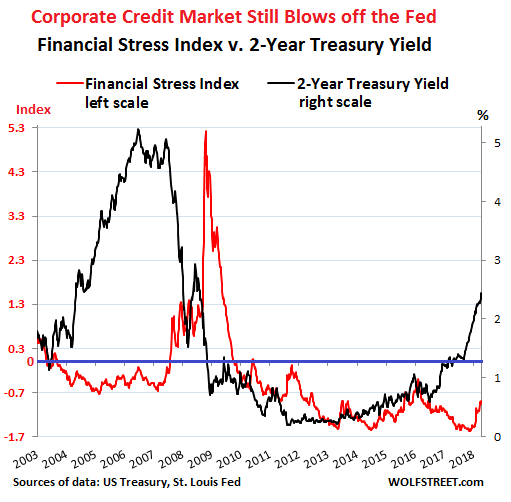
The two-year yield shot up in 2005 and 2006 as the Fed was raising rates and it overshot late in the cycle, when investors penciled in more rate hikes than were forthcoming. It peaked in June 2006 and then settled down some. By about that time, the Financial Stress Index started stirring. A year later, in July 2008, it reached “normal.” In September 2008, it began to spike with the Lehman bankruptcy.
So what we’re seeing in the chart above in the current cycle is the lag between the two-year yield, which has been shooting higher, and the actual tightening of the financial conditions, a process that is just now gradually starting to take off.
The Financial Stress Index is not a leading indicator. It just shows what’s going on in the credit markets right now. But the two-year yield is a leading indicator of financial stress in the credit markets.
The hope is that there won’t be a repeat of 2008. The huge spike in the Financial Stress Index was a sign that credit had solidly frozen over, and this had huge consequences in a credit-based economy.
The Fed has been indicating that it wants to “normalize” financial conditions – thus bringing the Financial Stress Index into positive territory near the zero line. There have also been suggestions recently that it may want to tighten beyond “normal,” in which case it would want to see the Financial Stress Index in positive territory. At the current pace, it has quite a ways to go, and rates will have to rise quite a bit further before the rest of the markets gets it and catches up with the Fed’s intentions.
Bonds, junk bonds, spreads, commercial real estate, leveraged loans, over-leveraged companies… all get named as risks to the banks. This is why “gradual” tightening will continue for a long time. Read… Now Even a Fed Dove Homes in on the “Everything Bubble”