Wolf Richter wolfstreet.com, http://www.amazon.com/author/wolfrichter
Chicago struggles, Dallas-Fort Worth, Atlanta, Minneapolis, Charlotte reach new highs. Drum-roll for Detroit and Cleveland!
This is the other side: Not every metro in the US has experienced the kind of blistering housing bubbles occurring in Miami or the San Francisco Bay Area, as illustrated in The Most Splendid Housing Bubbles in America: Year-Over-Year Declines Spread to Seattle. This is about the others among the 20 metros in the CoreLogic Case-Shiller Home Price Index, the metros that range from crushed markets — that are trying to dig themselves out — to blooming bubbles that haven’t quite yet qualified for the list of the Most Splendid ones.
Dallas-Fort Worth House Prices:
To the aggravation of homeowners and speculators at the time, the Dallas-Fort Worth metro skipped Housing Bubble 1, so called because it was the first housing bubble in this millennium. Consequently, they were spared Housing Bust 1. Now the metro is in a housing bubble of historic proportion: The Case-Shiller index for the Dallas-Fort Worth metro rose 0.5% in May from April, to a new record, and is up 70% over the past seven years! But as in many other bubble markets, the heat is fading: The index in May was up just 2.6% from a year ago, the weakest year-over-year gain since March 2012:
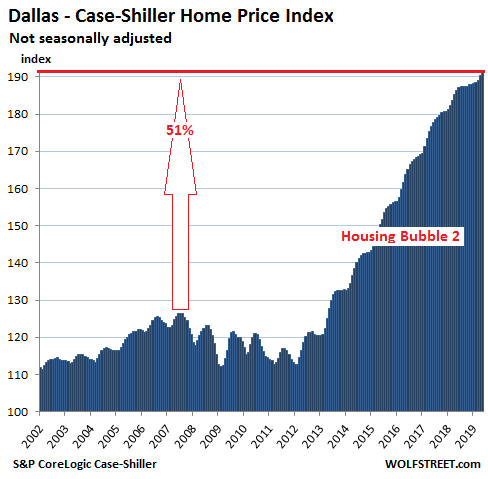
The Case-Shiller Index is a three-month average; the current release represents closings that were entered into public records in March, April, and May.
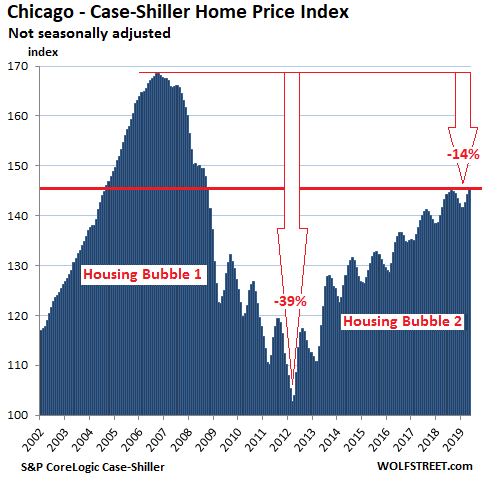
Chicago Home Prices:
Prices of single-family houses in the vast and diverse Chicago metro rose 0.8% in May from April, slightly less than last year’s seasonal uptick at this time. This whittled down the year-over-year gain further, to just 1.6%, according to the Core-Logic Case-Shiller Home Price Index. The index is still 14% below the crazy high of September 2006 at the peak of Housing Bubble 1:
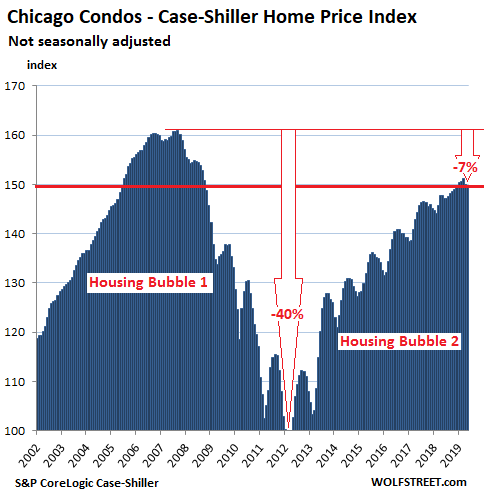
Prices of condos in the Chicago metro dropped 0.2% in May from April, the second month in a row of drops, which whittled down the year-over-year gain to 1.4%:
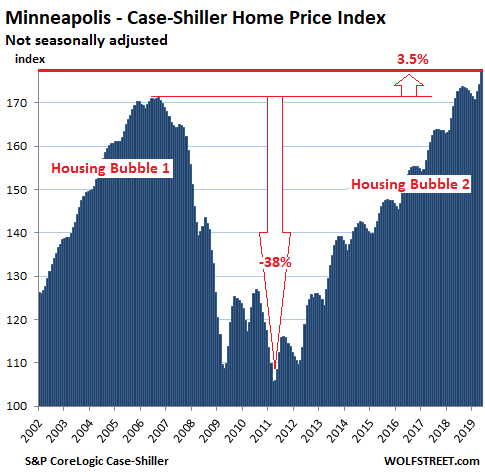
All charts here – except for the Dallas-Fort Worth metro above – are on the same scale. On the Chicago charts above and on the charts for the other metros below, the vertical axis ranges from 100 to 175 to fit Chicago’s Housing Bubble 1. The Case-Shiller Index was set at 100 for January 2000. A value of 175 means that prices have risen 75% since January 2000. The Dallas-Fort Worth metro blew past that scale, however; so it has its own scale. For the remaining metros below, the left scale is that of Chicago, topping out at 175, with some chilling effects for Detroit and Cleveland.
Minneapolis house prices:
House prices in the Minneapolis metro jumped 1.7% in May from April. On a year-over-year basis, prices rose 3.6%. The index is now 3.5% above the peak of Housing Bubble 1. The chart, which is on the same scale as Chicago’s chart, shows that the price changes during Housing Bubble 1 and Housing Bust 1 were similar in both metros, but during Housing Bubble 2, Minneapolis has pulled ahead of Chicago:
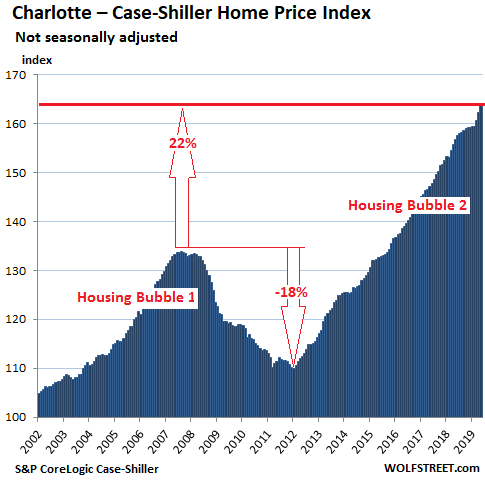
Charlotte house prices:
House prices in the Charlotte metro rose 1.0% in May from April, to another record, pushing the index up 4.5% from May last year, and 22% from the peak of Housing Bubble 1:
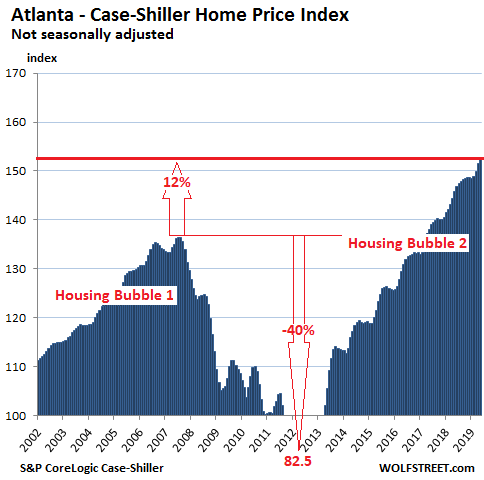
Atlanta house prices:
The Case-Shiller Index for the Atlanta metro ticked up 0.7% in May from April to a record, and is up 4.7% from May last year. This leaves the index 11.9% above its peak during Housing Bubble 1. During Housing Bust 1, the index plunged to 82.5, where it had first been in 1996. Note that the chart is also on the same scale as the charts for Chicago and the white space is beginning to grow:
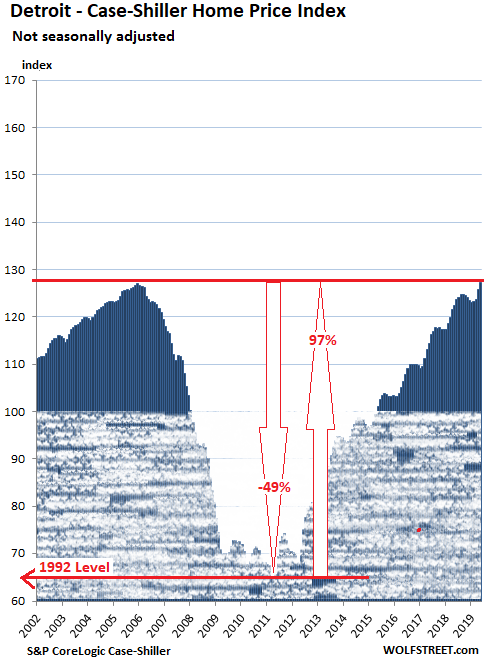
Detroit house prices:
House prices in the Detroit metro rose 1.2% in May from April to – drum-roll – its first new record since the peak of Housing Bubble 1 in December 2005, which hadn’t been much of a housing bubble in Detroit. From the bottom of this market just before the city’s bankruptcy, house prices have surged 97%. On a year-over-year basis, the index rose 4.0%.
To show the drama of this market, and just how far prices plunged from not very high levels to begin with, and to what extent they have surged since then, I have extended the scale downward. The shaded area shows the underwater part that the above charts don’t show. The 100-line on the left scale was set for Detroit’s house prices in January 2000. During Housing Bust 1, house prices fell to 1992 levels. They have now recovered to December 2005 levels:
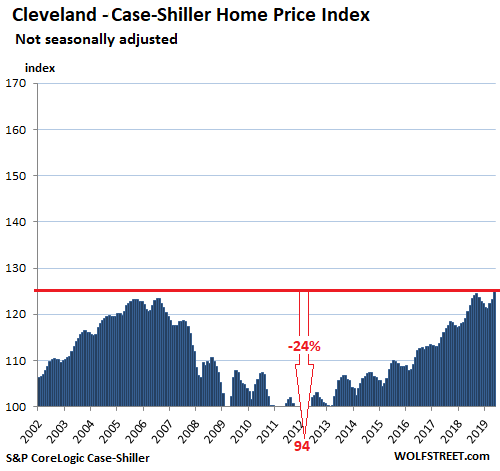
Cleveland house prices:
The Case-Shiller Index for the Cleveland metro jumped 1.4% in May from April and is up 3.6% from May 2018. With this move – another drum-roll – the index has finally edged past its record during Housing Bubble 1 of 2006. Since January 2000, the index has risen 25%, which would be about right in a normal non-bubble housing market, but in our bubble-and-bust-crazed times, it was the smallest increase of the 20 metros in the Case-Shiller Index:
Seattle House prices fell year-over-year, as did New York & San Francisco Bay Area condo prices. Los Angeles and San Diego house prices tick up. Denver and Boston jump to new highs. Las Vegas, Miami, Tampa, and Phoenix aspire to the crazy peaks of Housing Bubble 1. Read… The Most Splendid Housing Bubbles in America, July Update: Year-Over-Year Declines Spread to Seattle