by Dana Lyons
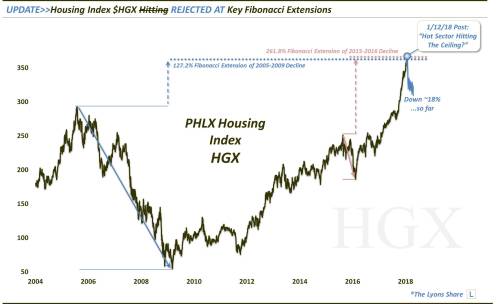
Back in January, we noted that one sector that had been on fire — housing stocks — was potentially at risk of cooling off. At least, that was our read on the group based on the chart of the PHLX Housing Sector Index (HGX). The HGX, at the time, had jumped more than 20% since breaking above its previous all-time high in late September. That high was set in 2005 near the 294 level. However, as we highlighted in the January post, the HGX had found its way up to 2 key Fibonacci Extensions near the 360-362 area:
- The 127.2% Fibonacci Extension of 2005-2009 Decline
- The 261.8% Fibonacci Extension of 2015-2016 Decline
In hindsight, we see that that juncture was indeed a good time to reduce exposure to housing stocks, as the HGX would top out just 7 days later, closing no higher than 365. And since then, it has been straight down for the HGX — to the tune of about -20%, as of yesterday.