via upfina:
Q2 earnings season has mostly finished, which makes it a great time to review results. Even though earnings drive stocks, the topic has been swept under the rug because of the trade war and monetary policy news. To be fair, the trade war and Fed rate cuts affect earnings. However, we can’t ignore the results. Earnings growth was positive again in Q2. To be clear, if the trade war continues, the global economy will be challenged, making it tougher to achieve earnings growth.
Earnings Update
Another reason earnings season has been swept under the rug is that results haven’t been terrible. It’s much easier to run stories about huge Dow point declines than modest earnings growth. More people would rather click on an article titled “Dow falls the most in 2019” than “Q2 earnings growth is 5.06%.” The problem with articles that react to market swings and don’t provide substance is that they don’t help anyone.
Speaking of substance, let’s review Q2 earnings season which has so far had 428 S&P 500 firms report results as if August 7th. As you can see from the table below, the blended estimate of Q2 S&P 500 EPS growth is 2.95%.
How is the escalation of the trade war impacting $SPY #earnings expectations? Check it out below pic.twitter.com/JEioU1upEK
— The Earnings Scout (@EarningsScout) August 7, 2019
Q2 has been a lot like Q1 as EPS growth at this point in the quarter is 5.06% and it was 5.29% at this point last quarter. EPS growth has been driven by the financials and healthcare which have seen 14.78% and 13.88% growth. Overall results have been driven by an average surprise of 4.22%. The laggards are industrials, energy, materials, and tech which have seen EPS declines of 0.8%, 3.96%, 4.06%, and 6.66%. Revenue growth has spiked above EPS growth unlike the last 3 quarters as its growth of 5.55% is being driven by an average surprise of 1.32%.
As you should be aware, stocks trade on future earnings which means earnings estimates are important. We can’t look too far into the future though because estimates always start at about 10% growth. It’s best now to look at the rate of change of Q3 and Q4 estimates. Estimates fell negative again in Q3 as they are -0.59%. The past 2 quarters had negative growth estimates at one point, but they ended up with positive growth because of estimate beats. That should happen again if Q3 estimates don’t fall much further. This entire year the most interesting quarter has been Q4 because its easier comps allow it higher EPS growth. The bears have harped on how Q4 EPS estimates are too high for a few months, but they are still solid. If estimates stay near where they are now, we could see double digit EPS growth which could be a bullish catalyst for equities.
The US Is On An Island
Having positive bond yields is becoming less common outside of the US. In prior cycles few economists would have imagined positive yields becoming unusual. We aren’t there yet, but the panic buying in treasuries has gotten us closer than almost ever. The 30 year treasury bond yield recently hit 2.12% which is just over 3 basis points above the all-time record low reached in July 2016. This isn’t an economic metric that has been out for a few decades. This is the history of America. It’s a very long time, to put it mildly.
Because it’s becoming less common for there to be positive yielding debt outside of America, the country is gaining a large portion of the yield payed out on debt. As you can see from the chart below, from 2013 to 2019 the US went from accounting for about 40% of the yield paid out in the global investment grade fixed income market to 88%.
An island of yield. US investment grade bond market accounts for almost 9/10 of all the yield left in the world. pic.twitter.com/IpLz7qlyB3
— Robin Wigglesworth (@RobinWigg) August 6, 2019
The US pays a disproportionate amount of the yield since it accounts for only half of the market.
The US Is Getting On Board
The Fed is getting on board with global central banks which are mostly easing. As you can see from the bottom chart below, 76.47% of central banks’ last rate change was a cut.
As has been the case for most of the past decade, global central banks are doing their part to support stocks – maybe time for other leaders to step up (or at least get out of the way). pic.twitter.com/y6LDDpKBqY
— Willie Delwiche, CMT, CFA (@WillieDelwiche) August 7, 2019
The relatively low percentage of central banks cutting in early 2019 was like 2011. The tables at the bottom show this easing has been a great sign for global stocks. Since 1989, equities have gained 7.87% per year when more than half of central banks are easing. The gain is 10.35% since 2009. Central banks matter more in this cycle as the difference between performance when central banks were easy versus hawkish was 8.13% since 1989 and 17.94% since 2009.
NY Fed Index Predicts More Unemployment Rates Will Rise
The chart below uses the same data as the one showing the odds of a recession being relatively high. It shows the NY Fed probability model’s (the yield curve) forecast for the percentage of states with a rising unemployment rate.
The % of US states with rising unemployment YoY is 29.4%, marginally above the level observed in 2016 of 27.5%. The NY Fed Recession Probability Model currently suggests this number is to rise considerably over the next 12 months, implying 68% of US states with a rising UR YoY. pic.twitter.com/XgprpURUwl
— Julien Bittel, CFA (@BittelJulien) August 7, 2019
Currently 29.4% of states have a higher unemployment rate this year versus last year. This model predicts that percentage reaching 68% in the next 12 months.
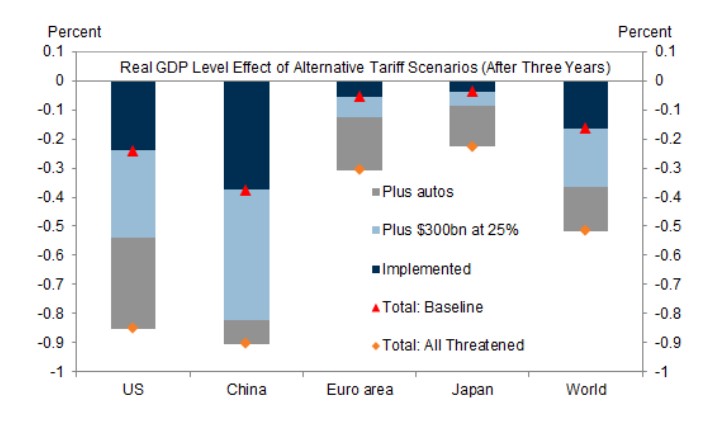
Tariffs Will Matter
The chart below shows the impact of tariffs on various areas.

This chart shows why it’s very important for America to avoid auto tariffs. Trump commented about taxing European cars when he announced the agreement for Europe to start buying more American beef. A tax on autos would be a disaster. What’s not a disaster is China’s latest trade data. It was solid despite the trade tensions. Exports in July were up 3.3% which beat estimates for a 2% decline. It was the fastest growth since March. June’s growth was -1.3%. Imports fell 5.6% which beat estimates for an 8.3% decline and June’s 7.3% decline.
Conclusion
Q2 earnings season has been solid. Q3 estimates will be negative when its earnings season starts, but the results will likely be positive. US firms pay out almost all the investment grade yield because global rates are so low. Most central banks are cutting rates which is good for global stocks. The yield curve implies more states will see their unemployment rates rise. The tariffs will hurt economic growth. That being said, Chinese trade data in July came in better than expected.