By Wolf Richter for WOLF STREET.
No one has ever been through an economy where enormous shifts have occurred, from one day to the next, shutting down part of the economy but also generating sectors that are vastly more vibrant than ever before. Monthly or quarterly economic indicators leave us in the dark because they lag too far behind and are at the moment largely useless. What we need is high-frequency data – daily and weekly that track this shifting economy in near-real time.
For example, there has been an enormous boom in ecommerce – but we won’t get ecommerce data for Q1 until mid-May and for Q2 until August. Best Buy reported last week that its online sales had surged by 250% but that it would furlough 51,000 hourly store employees as stores were closed to customers, allowing only for curbside pickup. That duality that is now widespread impacts the economy in strange ways.
Grocery store and supermarket sales – which are normally the epitome of slow and steady growth tied to inflation and population growth – are suddenly booming. Kroger reported a 30% surge in “identical retail supermarket sales without fuel.”
Anything having to do with working-at-home, including hardware sales, is booming. Everything and anything that is online is booming — as are the sectors that make it all work, including delivery services. And there are other sectors that are suddenly hot.
But other parts of the economy have essentially collapsed, with near-zero revenues, such as sit-down restaurants, sports & entertainment events, or the entire travel and accommodations industry, including airlines and hotels.
Some manufacturing plants are operating, but many others are not. Much of the construction industry has shut down. Housing and auto sales are still ongoing, but at far lower levels.
Supply chains are misaligned, insufficient for the surging activity at supermarkets and ecommerce, but useless for commercial venues such as restaurants and schools that have been shut down.
There have been some shortages of meat at grocery stores. But meat meant for restaurants is stuck because the meatpackers and middlemen for the restaurant and cafeteria industry are either not part of the long-established supply chains of large supermarkets, or the packaging and quality is inappropriate for supermarkets. A lot of smart people are trying to resolve these supply chain issues.
Agriculture is operating mostly. Oil drilling has collapsed because of the demand for oil has collapsed, and the entire supply chain to the oil-and-gas sector, including the equipment manufacturing sector, and the services supporting it all have ground to a halt.
Consumers are still spending money, but they’re spending less, and they’re spending it in different ways. So estimating where GDP will be in an economy that has shifted so suddenly and so dramatically, and where activity in many sectors has plunged from one day to the next is going to be tough.
But here is one effort, initiated in early March in its current form: The New York Fed’s Weekly Economic Index (WEI), released today for the week ending April 18, is based on ten daily and weekly indicators – “timely and relevant high-frequency data,” as it says – of “real economic activity.” These indicators cover consumer behavior, the labor market, and production. The researchers putting the index together have scaled the index “to align with the four-quarter GDP growth rate.”
The index has plunged over the past five weeks to -10.95%. If this reading persists for the entire second quarter, then the year-over-year GDP plunge in Q2 is expected to be around -11%:
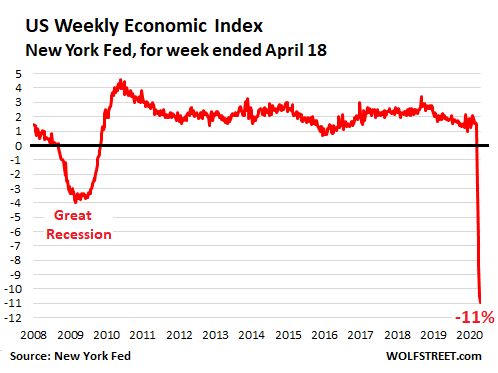
The above chart shows how the index declined during the Great Recession. The index turned negative at the beginning of October 2008 and then plunged. Weekly declines were between 3% and 3.8% starting in December 2008 through August 2009. Then the declines abated.
By comparison, real GDP during the Great Recession fell 2.8% year-over-year in Q4 2008, 3.2% in Q1 2009, 3.9% in Q2 2009, and 3.1% in Q3 2009.
The chart below, which covers 2019 and 2020 so far, shows the plunge in economic activity by week over the past five weeks. Before it all started, the economy wasn’t all that hot, with diminishing growth rates last year and into this year. For the week ending February 29, on the eve of the lockdowns, the WEI was at 1.58%:
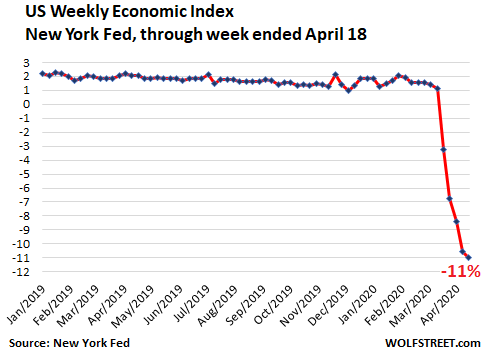
The WEI gives us a feel of what GDP might look like in this new economy. The Great Recession, with GDP declining at less than one-third the rate indicated by the WEI, was bad enough. Today’s 11% plunge in the WEI points at a recession that would be three times deeper than the Great Recession, if the WEI persists at this level.
These are the 10 data series employed by the WEI:
- Redbook Research: weekly same-store sales
- Initial claims for unemployment insurance
- Continuing claims for unemployment insurance
- Staffing Index by the American Staffing Association
- Rasmussen Consumer Index
- Raw steel production (from American Iron and Steel Institute)
- Electric utility output, excl. Hawaii & Alaska (Edison Electric Institute)
- US fuel sales to end users (NY Fed calculations based on EIA data)
- US railroad traffic
- Federal withholding tax collections (Booth Financial Consulting)
The initial claims for unemployment insurance alone appear to be on a similar “three times worse” trajectory, pointing to an increase of around 25-30 million unemployed, compared to an increase of around 10 million unemployed during the Great Recession. So in terms of depth, not duration, “three times deeper than the Great Recession” might be a useful approximation until more data emerges.